MARKET INSIGHT POST
Q4-2023 Minneapolis-St. Paul Office Market Update

Forte Principal, Jim Jetland lends insight to the Twin Cities office market report recently released by MNCAR/REDI.
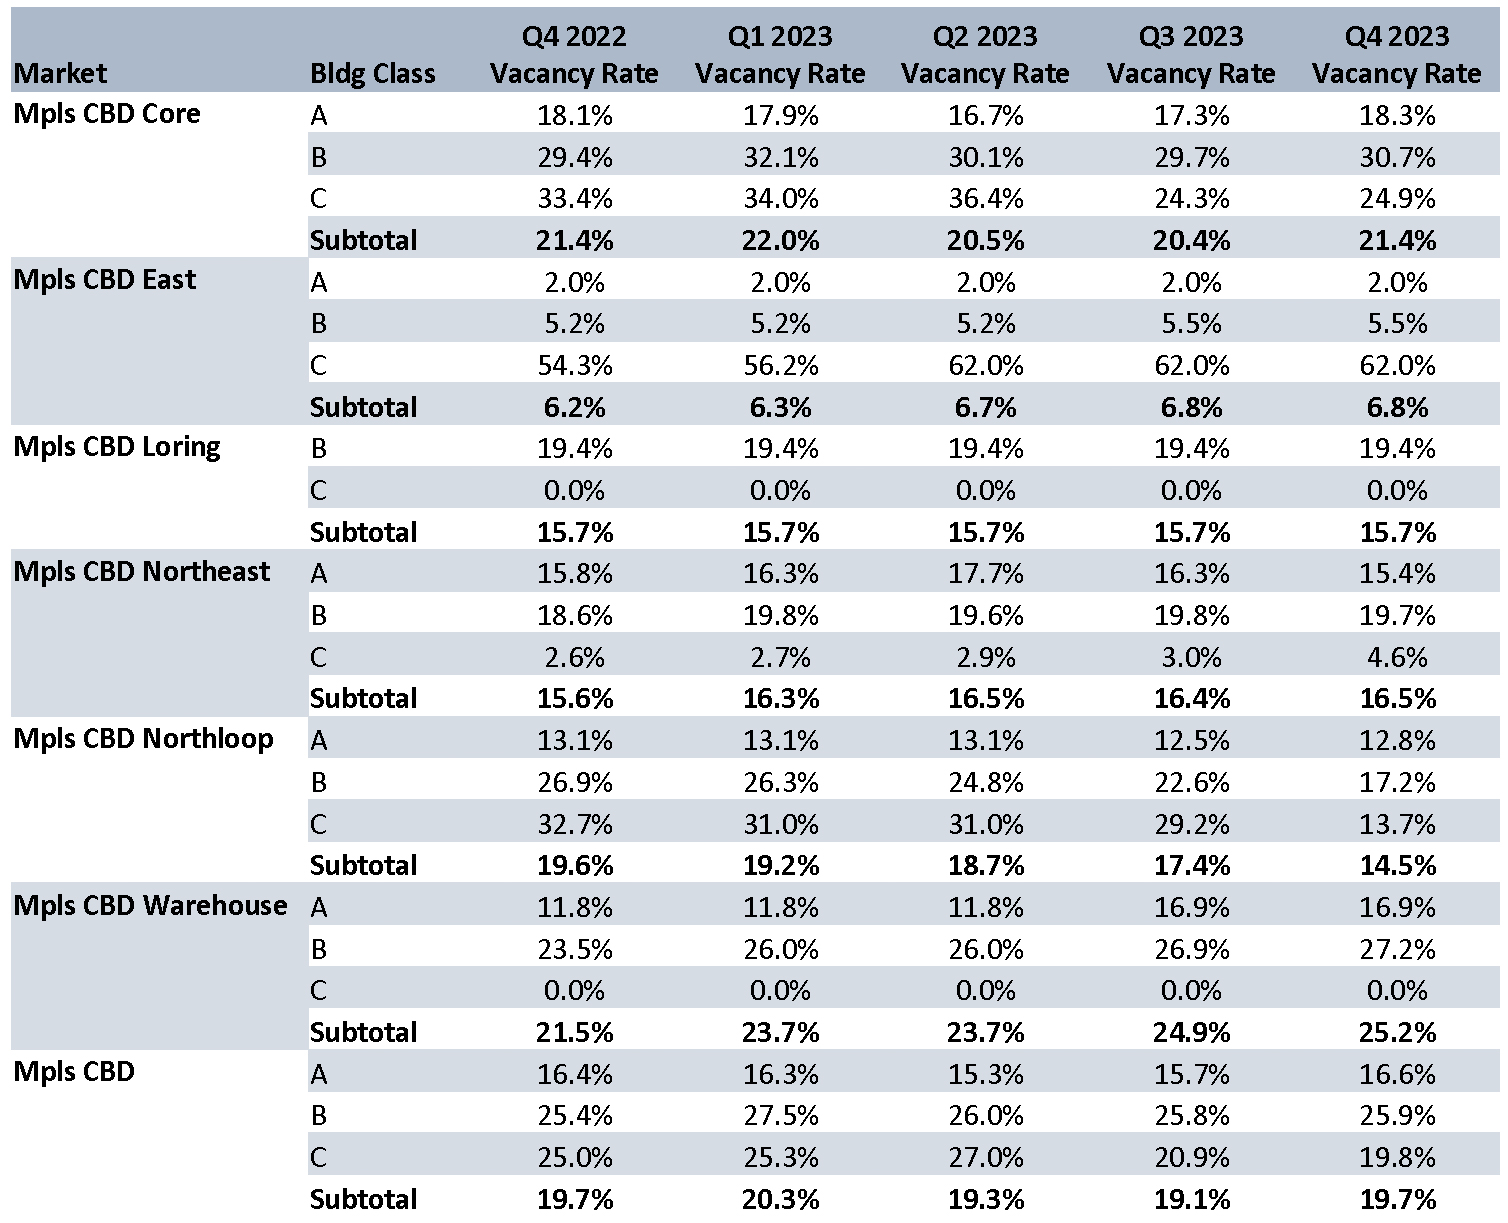
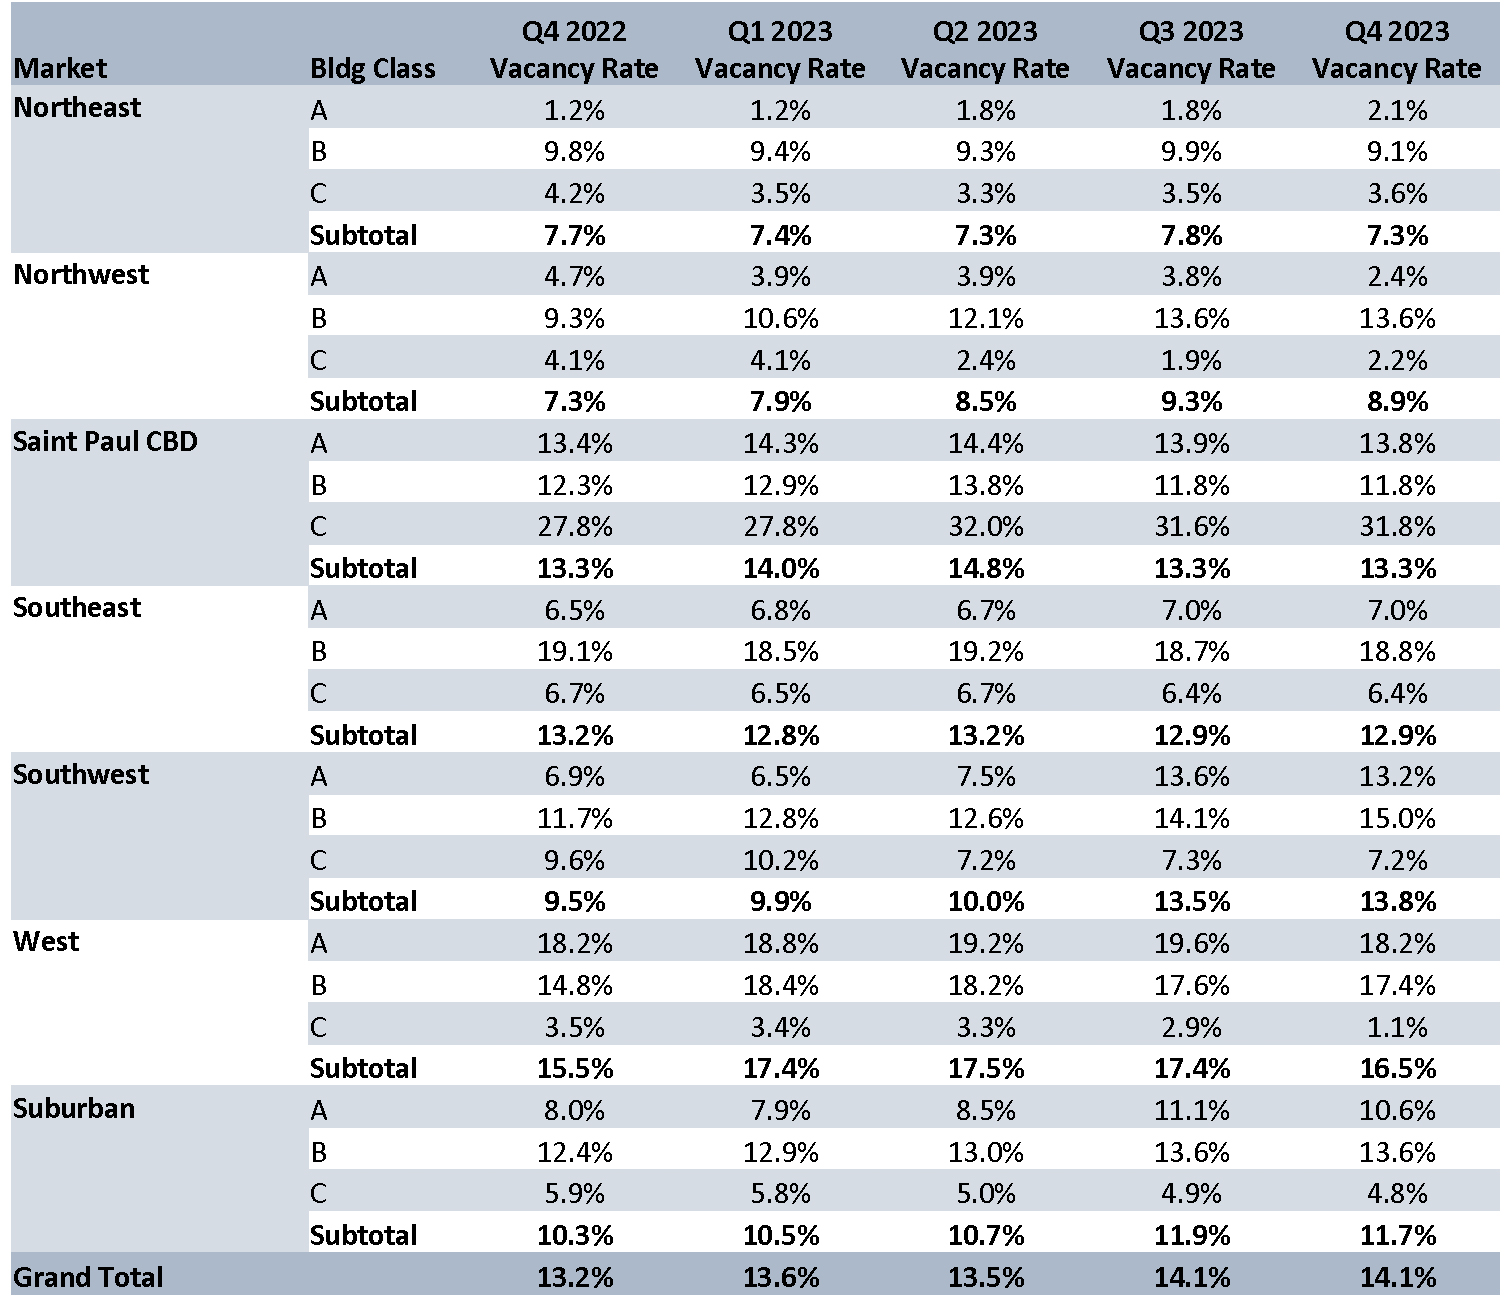
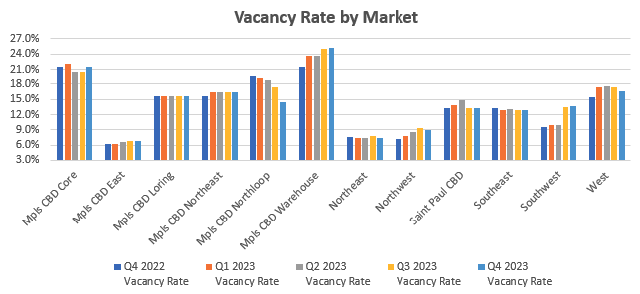
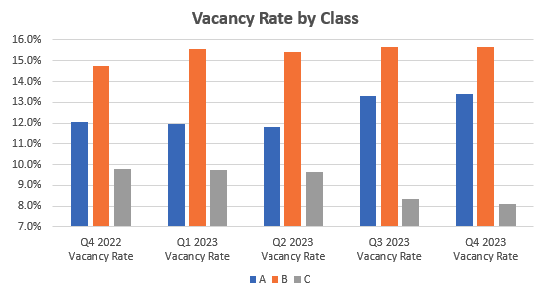
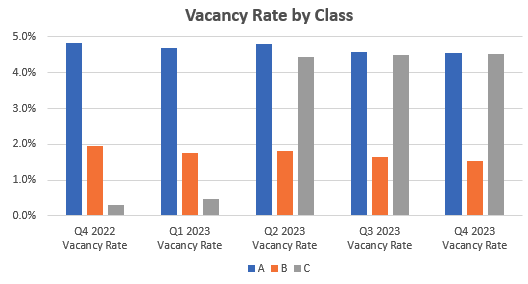
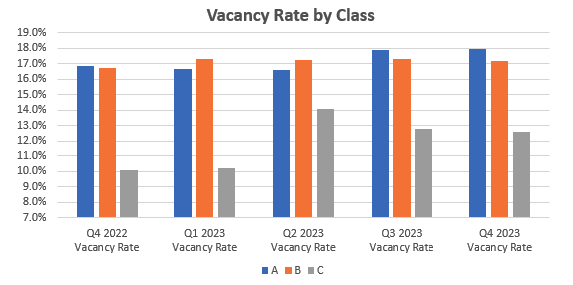
At the risk of sounding like a “broken record” the office market in the Twin Cities remains challenged. Collectively, absorption was negative in all building classes, the number of subleases coming to the market increased, and overall vacancy increased slightly across most submarkets. The good news is that none of the negative numbers had significantly increased over the last quarter which could be a sign of the downside flattening but time will tell as more leases expire and the “new normal” becomes more apparent.
On the positive side there continue to be a select number of buildings in the most active markets that see good activity. They are well located buildings with strong area amenities and deeper building amenities. The flight to quality continues to be a trend. Another trend that is having a positive impact on the office sector is the concept of healthcare users considering the more traditional office buildings for space instead of the more expensive medical office buildings. There have been several healthcare related tenants that have recently signed leases which has helped offset a decline in size and the number of traditional office tenants in the market. Some of the healthcare clients to recently sign leases include Skin Rejuvenation, Noran Neurology, Summit Orthopedics, Allina, and Northwest Eye to name a few.
Q4-2023 Office Market Update
ECONOMIC OVERVIEW:
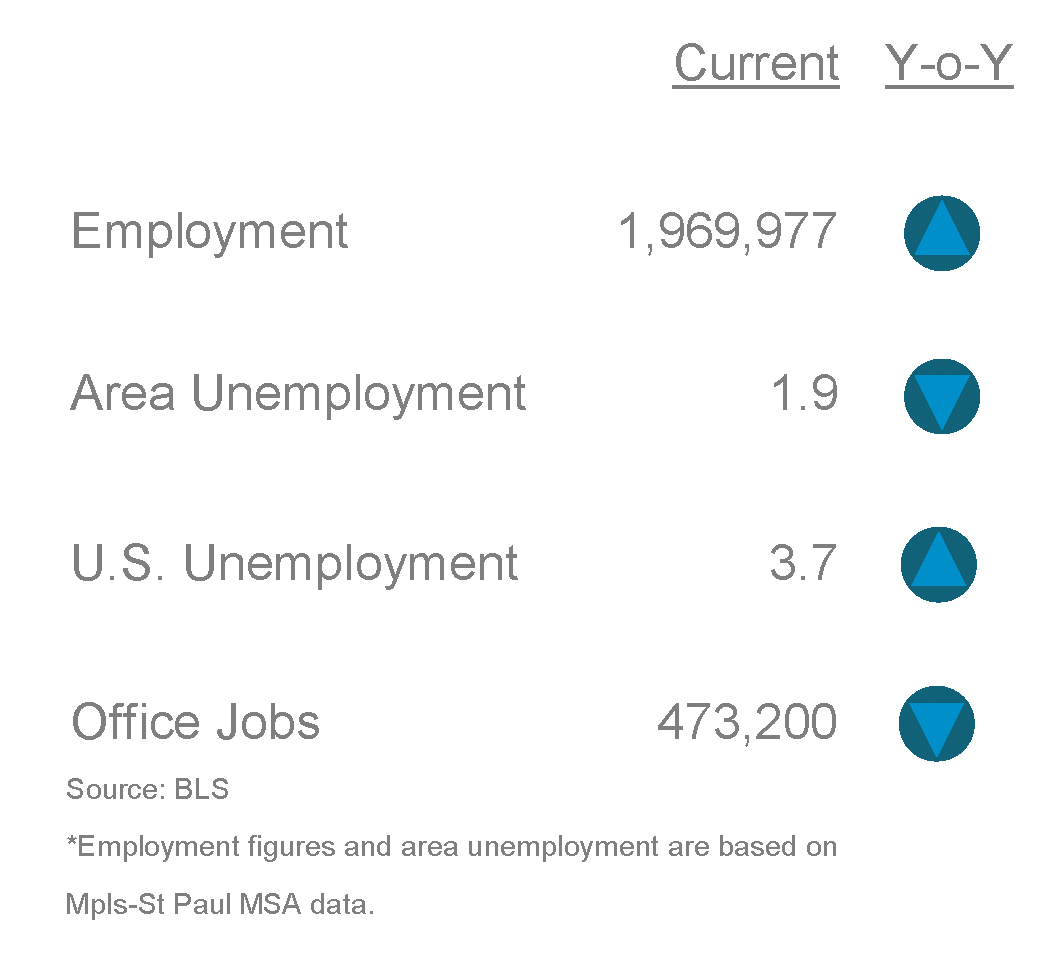
According to the Bureau of Labor Statistics (BLS), the unemployment rate for the Mpls-St Paul metropolitan statistical area (MSA) decreased 50 basis points to 1.9% for November 2023 from 2.4% for November 2022. The unemployment rate for the US was at 3.7% in November 2023 increasing 10 basis points from last year. State of Minnesota unemployment rate was 3.1%. The Mpls-St Paul MSA saw an increase in job growth but office decreased in job growth in professional, financial and information with 15,900 during the same period.
MARKET OVERVIEW:
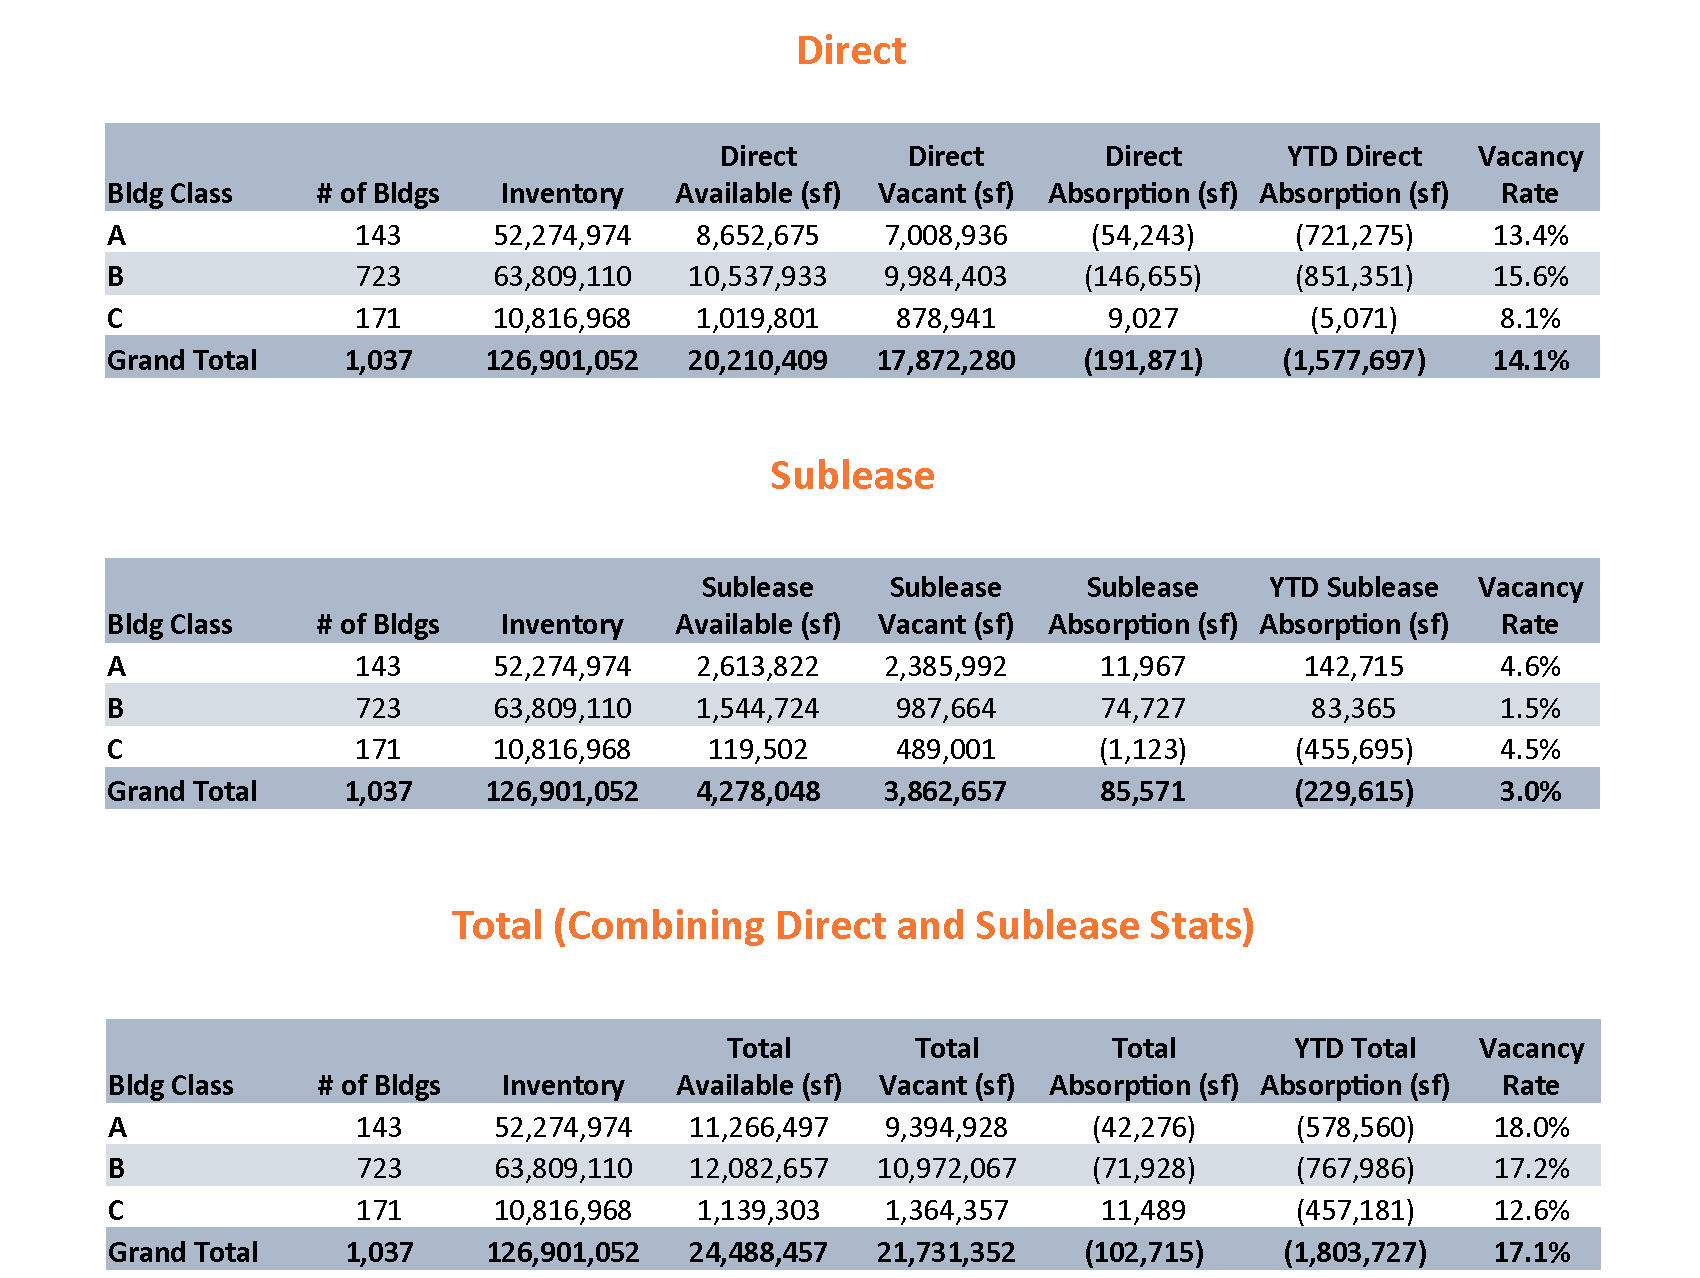
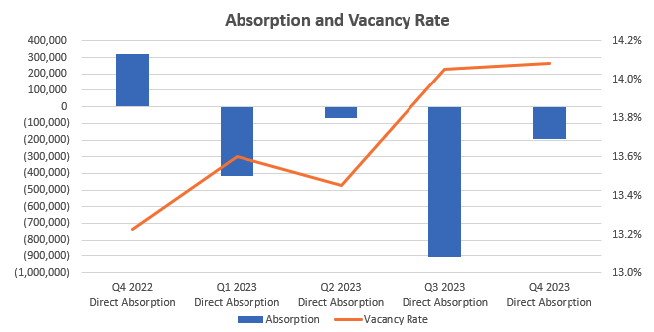
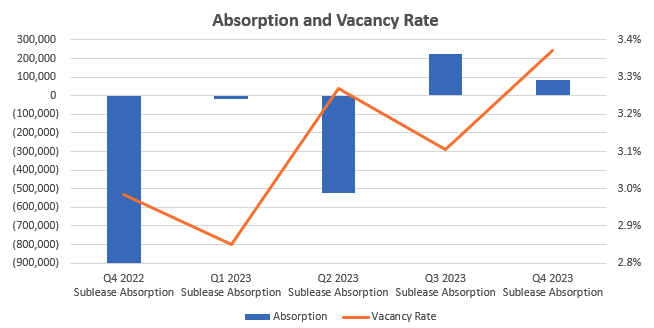
The Mpls-St Paul office market, consisting of 127.9 msf of space in seven metro counties. This region posted (102,700) sf of negative absorption for Q4 2023 and showed an overall vacancy rate of 17.1% for all properties. This quarter showed (191,800) sf of direct negative absorption while subleases accounted for (85,500) sf positive absorption. Multi-tenant only properties posted 21.8% vacancy with (102,700) sf negative absorption. There was (191,800) sf negative absorption for direct space, and 85,500 sf positive absorption for subleases. During Q4 2023 there were 4 construction projects throughout the market totaling 423,000. Seventeen properties have been delivered this year with 554,000 sf.
MARKET HIGHLIGHTS:
During Q4 2023, the market experienced over 1.9 msf of leasing activity in 310 transactions. For direct leasing, Mpls CBD markets posted (190,800) sf negative absorption led by Lathrop downsizing 77,000 sf. The suburban markets posted (2,300) sf. The West market had the most direct positive absorption of 91,000 sf led by Insight Global leasing 25,000 sf. St Paul CBD posted 1,300 sf positive absorption. Eighty one properties with 935,000 sf sold for $101 million this quarter.
MPLS-ST. PAUL AREA EMPLOYMENT STATS:
MARKET RECAP:
All Properties:
Total Inventory: 126,901,052 sf
Total # of Buildings: 1,037
Absorption: (102,715) sf
Vacancy: 17.1%
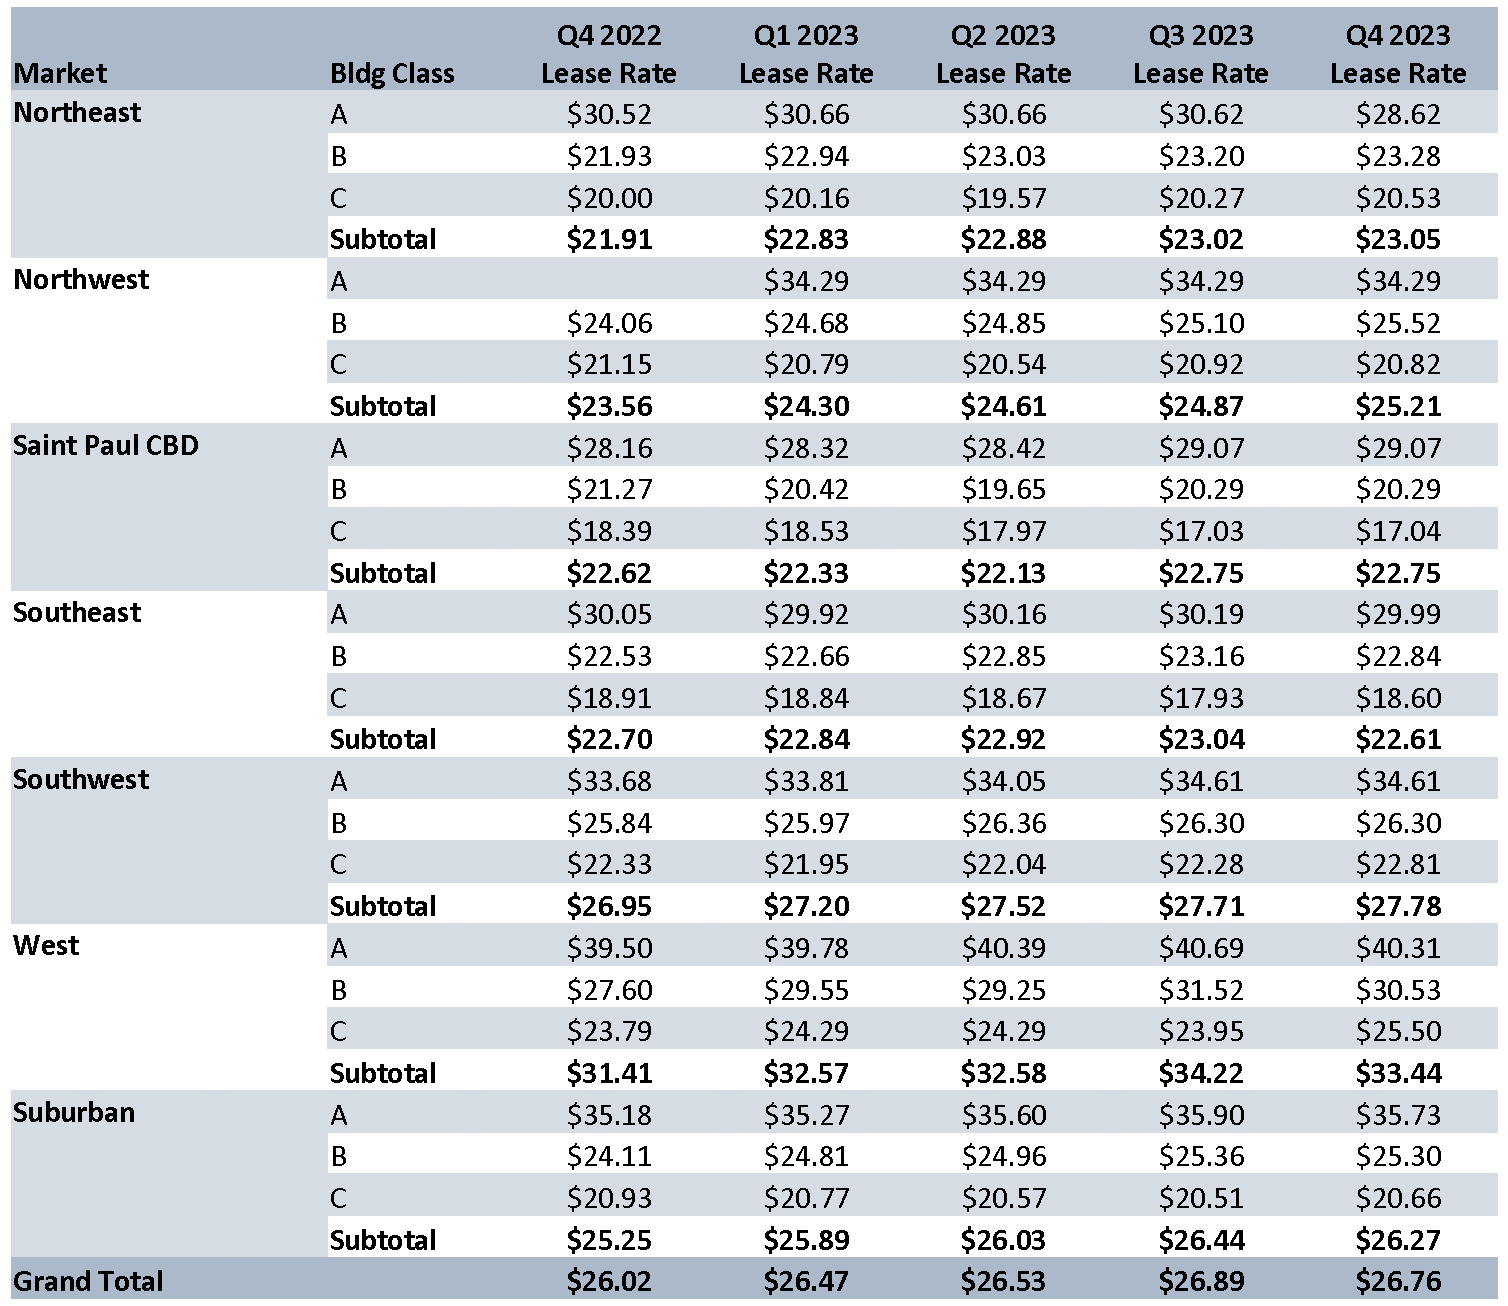
Asking Rate: $26.76 NNN
New Construction: 423,187 sf
Multi-Tenant Properties
Total Inventory: 87,914,356 sf
Total # of Buildings: 837
Absorption: (102,715) sf
Vacancy: 21.8%
Asking Rate: $26.77
MARKET STATS BY BUILDING CLASS (Multi and Single Tenant)
ABSORPTION & VACANCY RATE (Multi and Single Tenant)
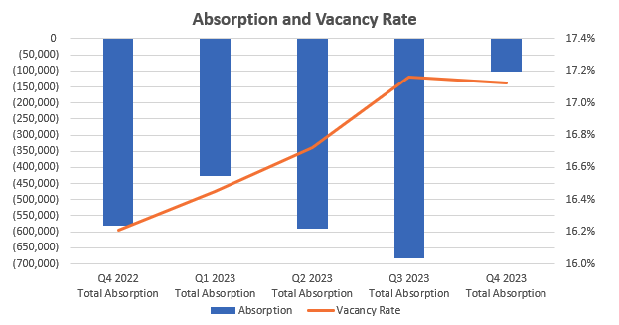
MARKET STATISTICS BY MARKET (Direct Multi and Single Tenant)
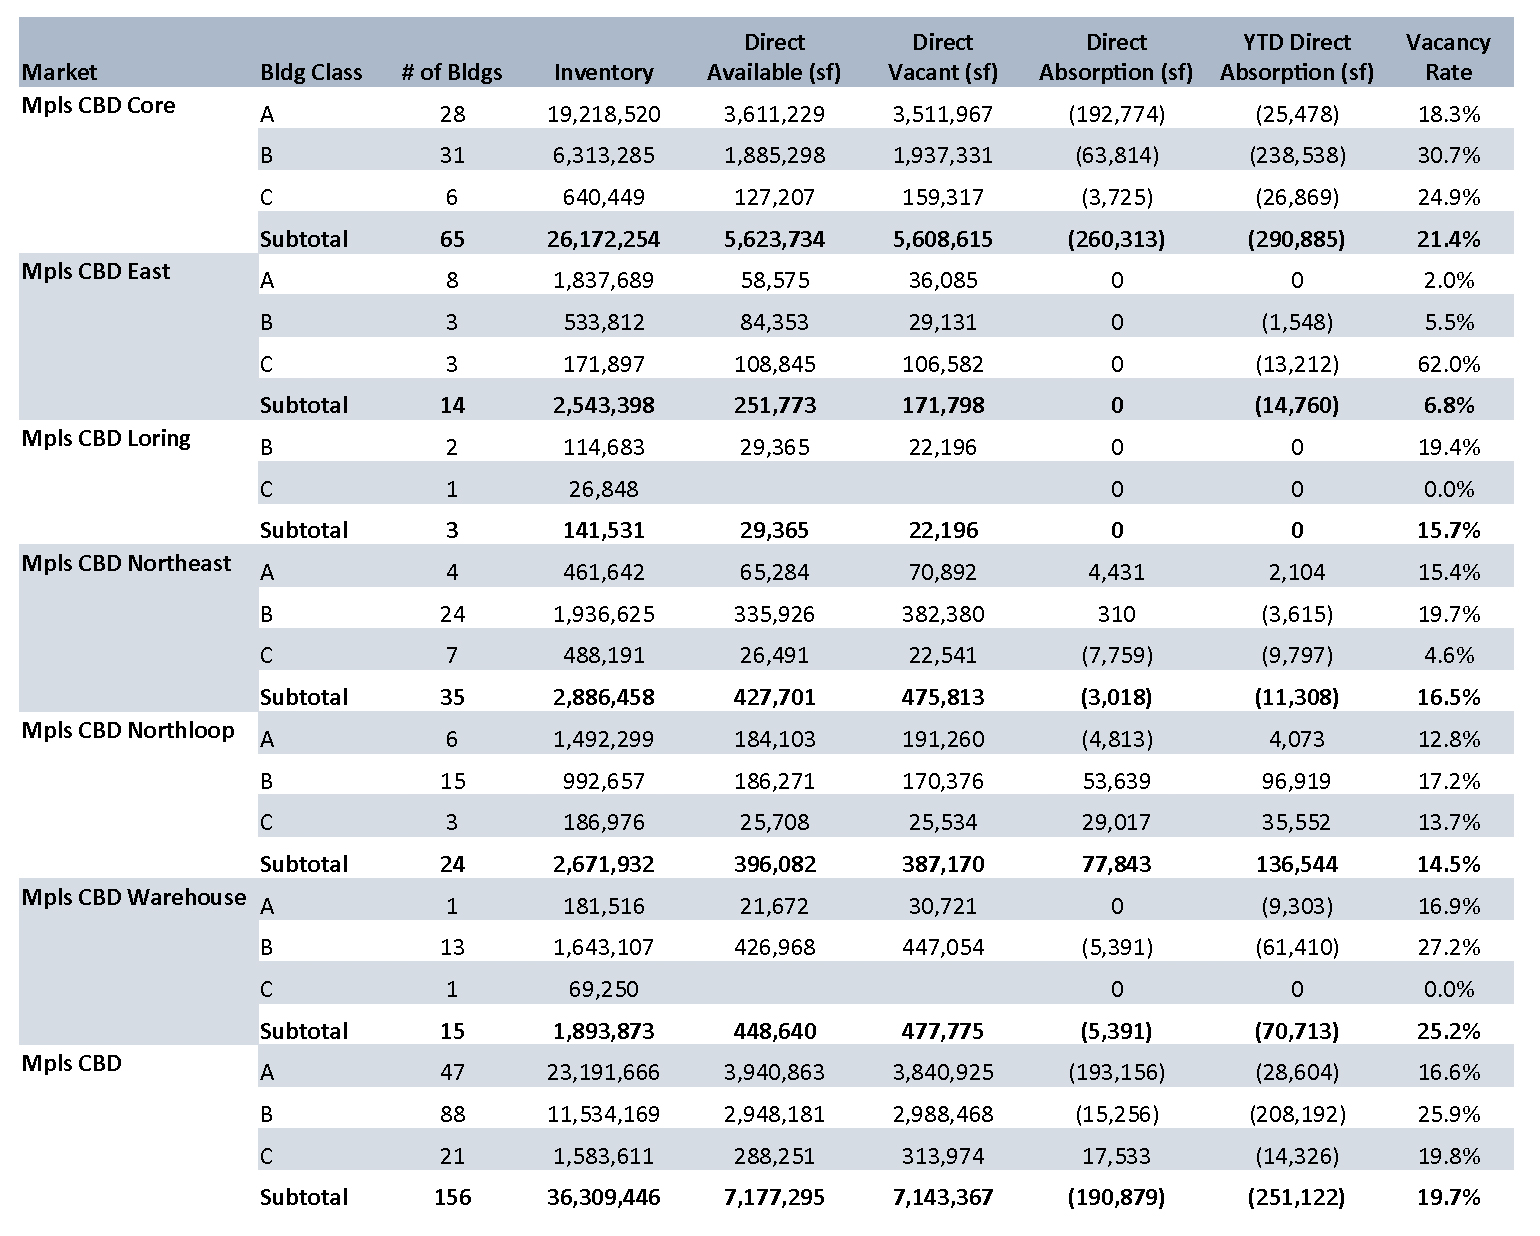
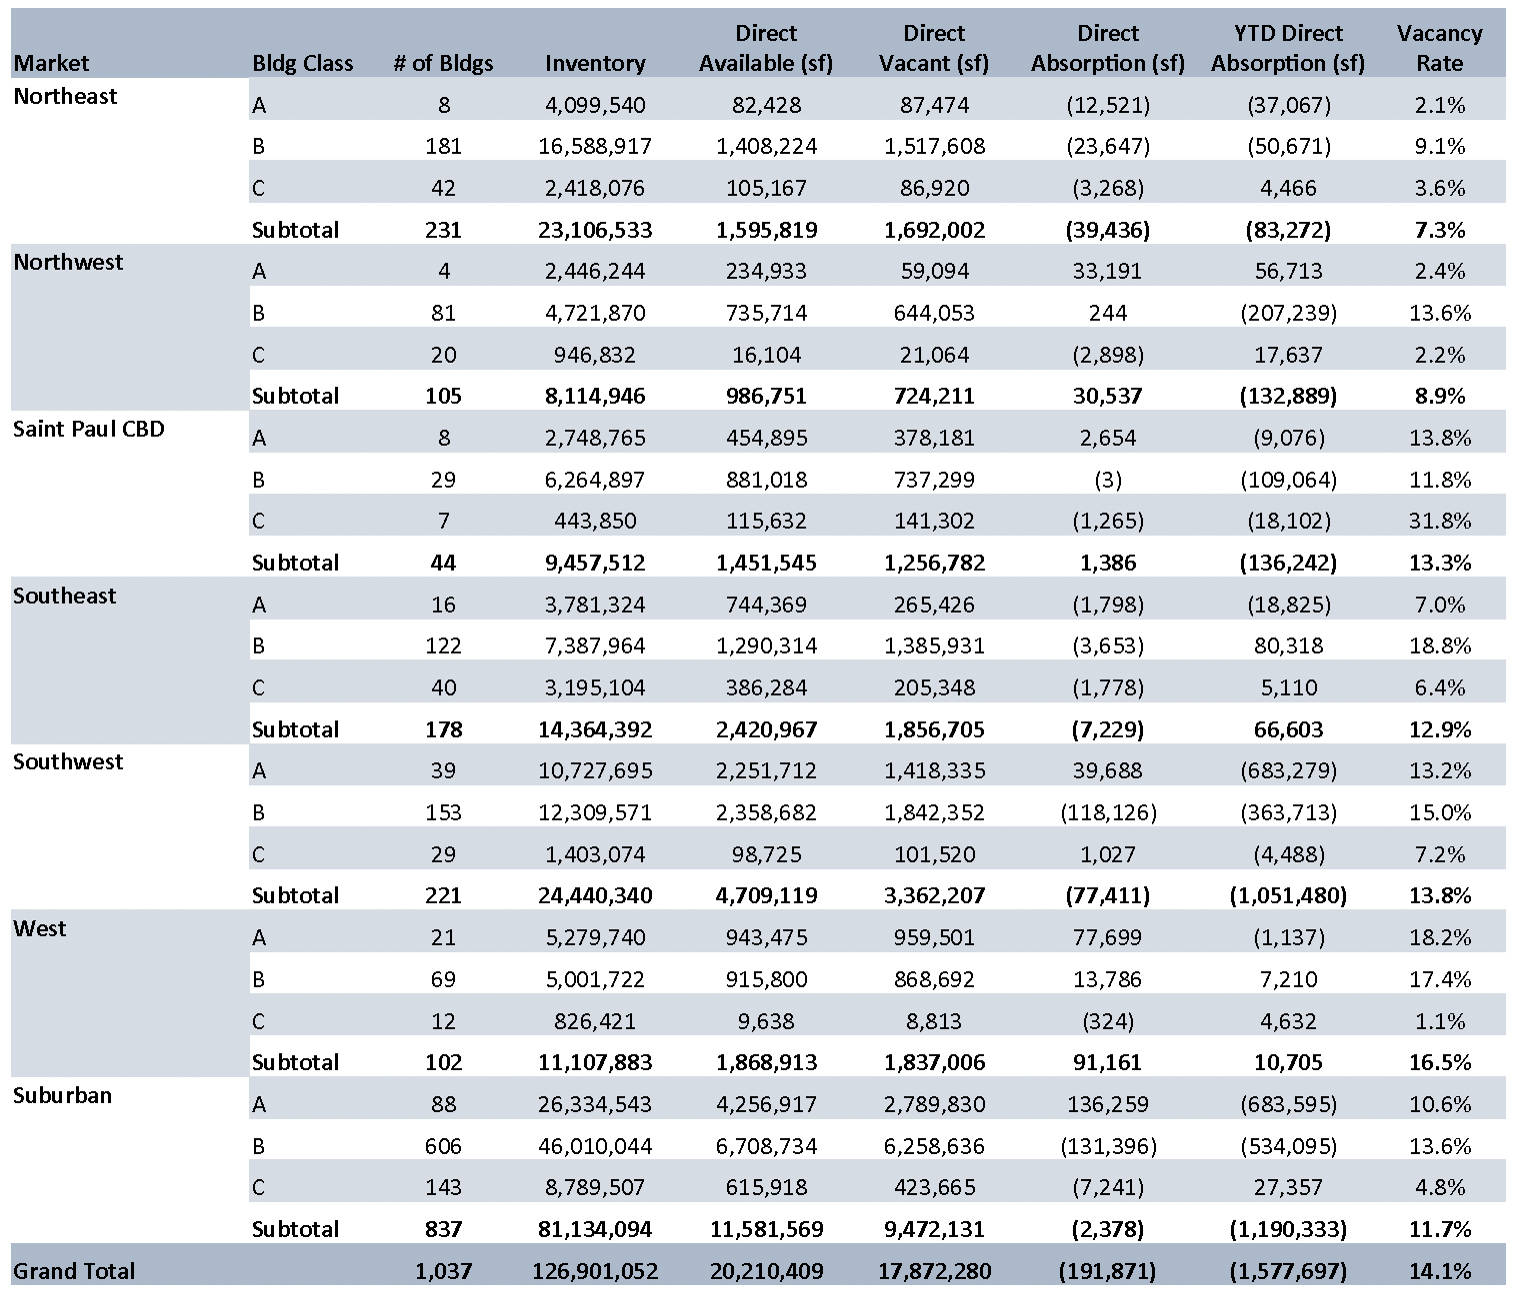
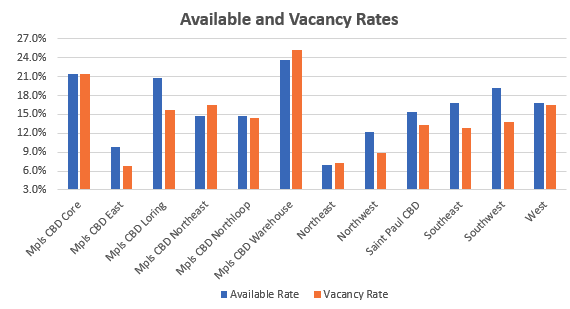
VACANCY RATES BY MARKET (Direct Multi and Single Tenant)
VACANCY RATES BY BUILDING CLASS (Multi and Single Tenant)
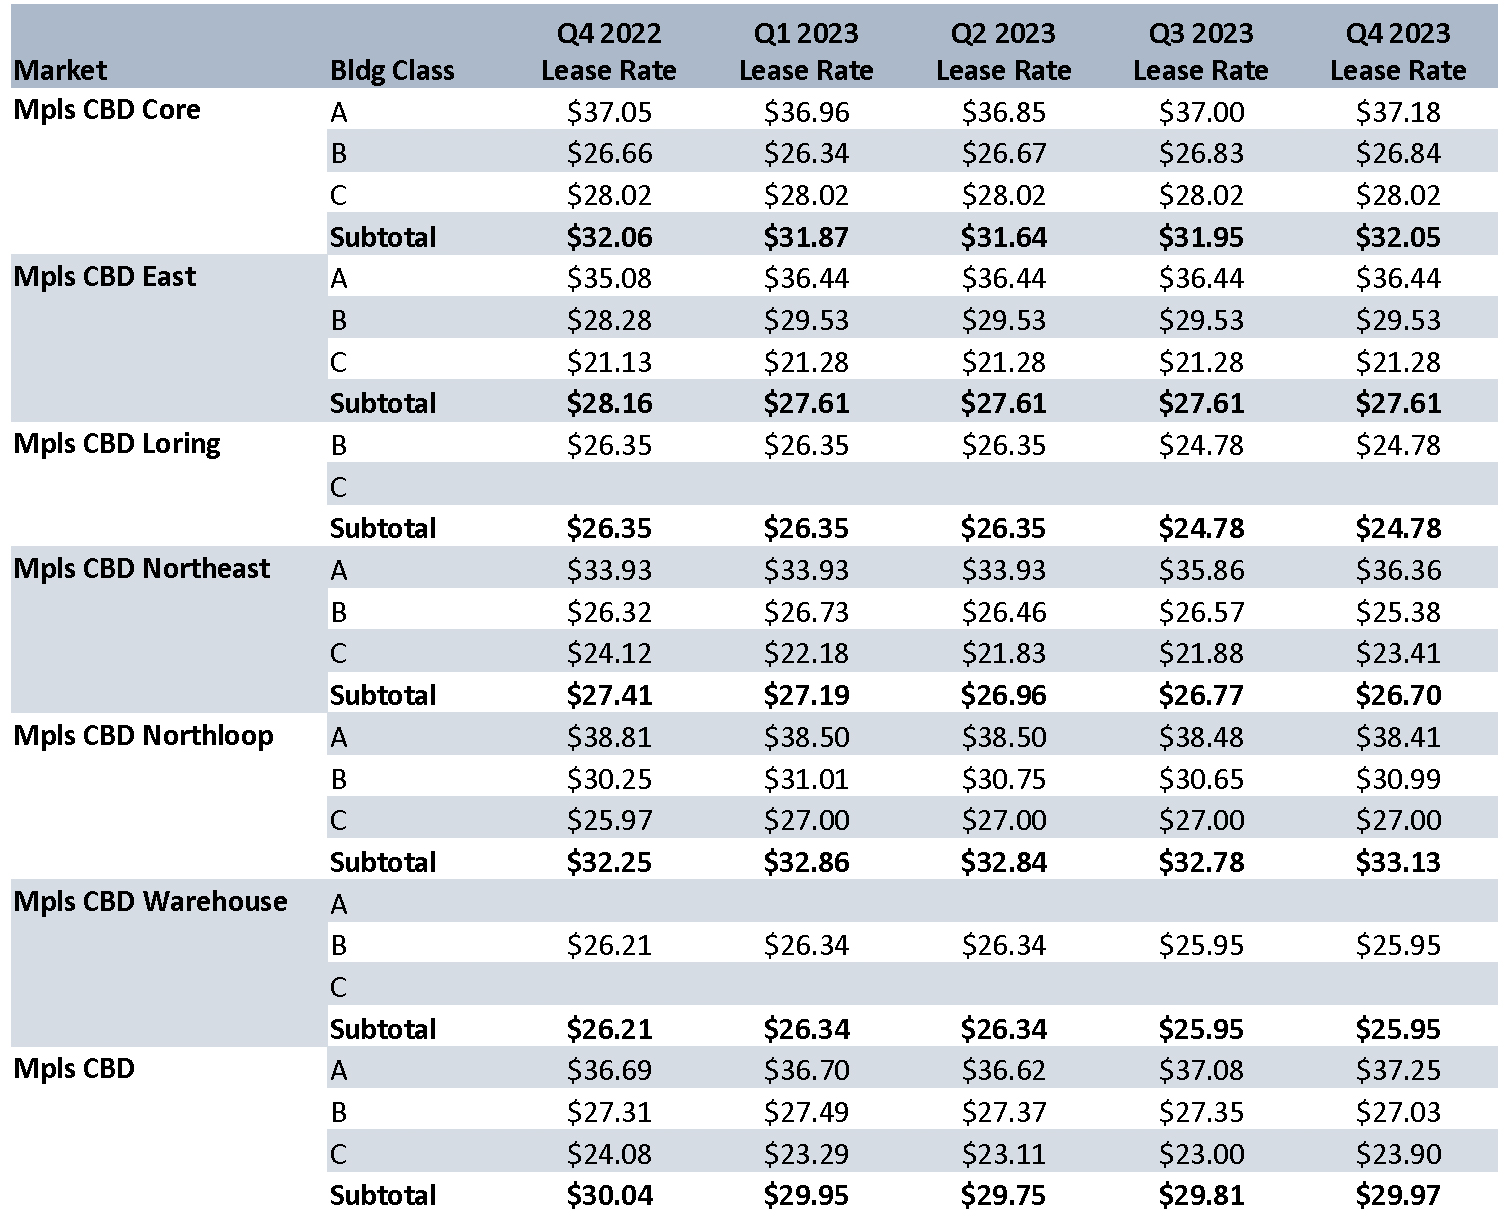
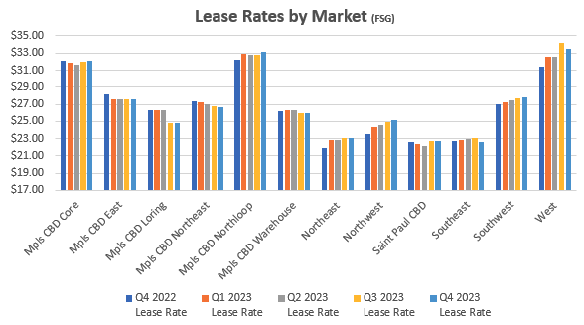
LEASE RATES BY MARKET (Direct Multi and Single Tenant FSG)
NEW DEVELOPMENTS

YEAR-TO-DATE DELIVERIES

MARKET MAP

Market Insight
Office Advisory Experts


News
Q2 2025 Minneapolis-St. Paul Office Market Summary
MARKET INSIGHTQ2 2025 Minneapolis-St. Paul Office Market Summary Q2 2025 Twin Cities Office Insights: A Tale of Two Markets Forte’s Erik Nordstrom, Senior Associate-Real Estate Advisory, provides insight to the Twin Cities office market report recently released by...
Q1 2025 Minneapolis-St. Paul Office Market Summary
MARKET INSIGHTQ1 2025 Minneapolis-St. Paul Office Market SummaryFuture of Twin Cities Office Space: Smaller, Smarter, and Sustainable Forte’s Kate Damato, Senior Associate-Real Estate Advisory, provides insight to the Twin Cities office market report recently...
Q1 2025 Minneapolis-St. Paul Industrial Market Summary
MARKET INSIGHTQ1 2025 Minneapolis-St. Paul Industrial Market SummaryTwin Cities industrial market enters 2025 with sustained momentum in absorption and decreasing vacancy By: Erik Nordstrom, Senior Associate-Real Estate Advisory provides insight to the Twin Cities...


