(952) 854-8290 info@forterep.com

MARKET INSIGHT POST

Q3-2023 Minneapolis-St. Paul Office Market Update

Q4-2022 Minneapolis-St Paul Office Market Report
Forte Principal, Jim Jetland, SIOR, lends insight to the Minneapolis-St. Paul office market report recently released by MNCAR/REDI. As more office leases are expiring and most tenants contemplate their future office space needs, the trend is to downsize the current footprint. This trend directly impacts the market vacancy rate as it continues to rise. It is expected that this phenomenon will continue over the next few years and negatively impact the overall Twin Cities office market. On the positive side, there are some office buildings benefitting from another trend which is a flight to quality as many tenants look to elevate their work environment in hopes of luring more employees back to the office. While most tenants are downsizing their footprint, they are also considering relocation to those buildings that offer an upgraded experience with expanded amenities and tenant-focused events. Landlords that are well capitalized and willing to take the chance on upgrading their buildings amenities and offerings will benefit from this trend while the others will continue to be challenged to succeed.

Q3-2023 Office Market Update

ECONOMIC OVERVIEW:
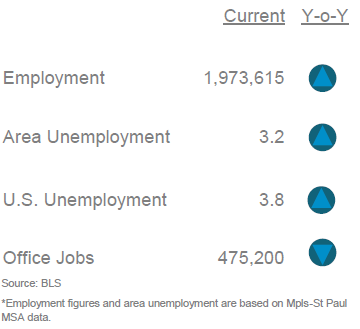
According to the Bureau of Labor Statistics (BLS), the unemployment rate for the Mpls-St Paul metropolitan statistical area (MSA) increased 50 basis points to 3.2% for August 2023 from 2.7% for August 2022. The unemployment rate for the US was at 3.8% in August 2023 increasing 10 basis points from last year. State of Minnesota unemployment rate was 3.1%. The Mpls-St Paul MSA saw an increase in job growth but office decreased in job growth in professional, financial and information with 7,900 during the same period.
MARKET OVERVIEW:
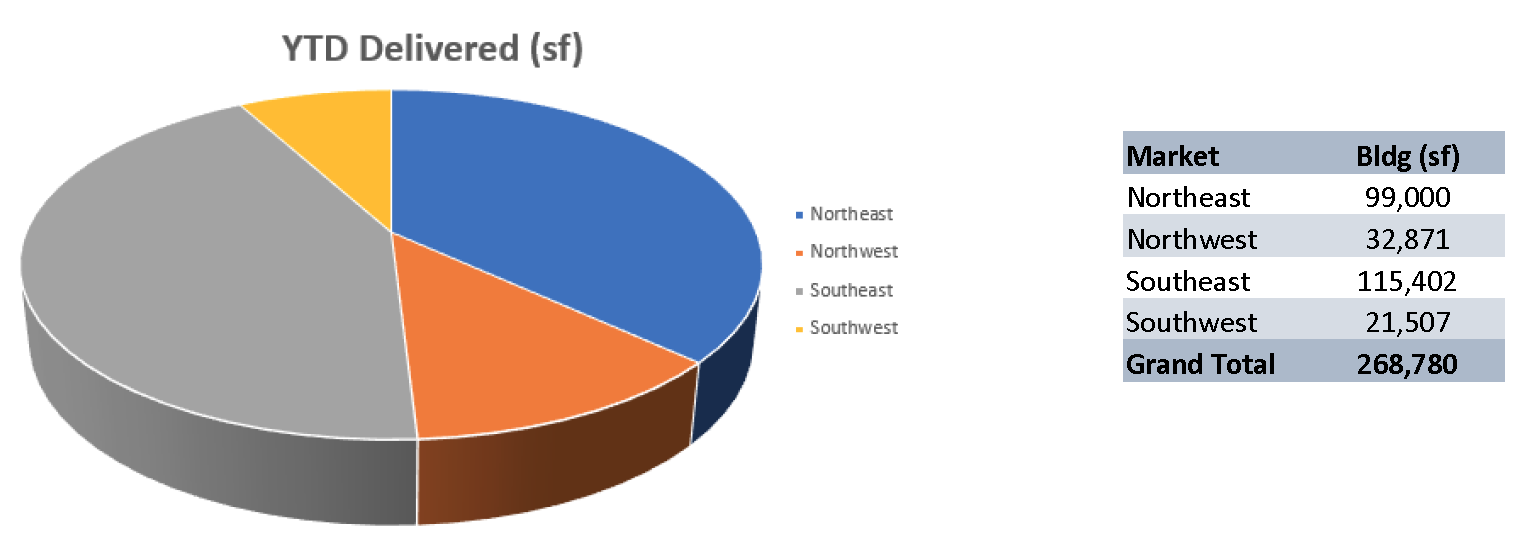
The Mpls-St Paul office market consists of 127,4 msf of space in seven metro counties. This region posted (682,748) sf of negative absorption for Q3 2023 and shows an overall vacancy rate of 17.0% for all properties. This quarter showed (892,700) sf of direct negative absorption while subleases accounted for 210,000 sf positive absorption. Multi-tenant only properties posted 21.4% vacancy with (270,000) sf negative absorption. There was (412,500) sf negative absorption for direct space, and 142,000 sf positive absorption for subleases. During Q3 2023 there were 12 construction projects throughout the market totaling 744,000. Ten properties have been delivered YTD with 268,700 sf.
MARKET HIGHLIGHTS:
During Q3 2023, the market experienced over 1.43 msf of leasing activity in 319 transactions. For direct leasing, Mpls CBD markets posted (66,000) sf negative absorption. The suburban markets posted (892,000) sf negative absorption led by Best Buy vacating their single tenant HQ with 600,000 sf in the Southwest market. St Paul CBD posted 19,000 sf positive absorption. Sixty four properties with 1.5 msf sold for $325 million this quarter.  
MPLS-ST. PAUL AREA EMPLOYMENT STATS:
Q1 2023 Mpls-St Paul Office Employment Stats
MARKET RECAP:
All Properties: Total Inventory: 127,483,069 sf Total # of Buildings: 1,040 Absorption: (682,748) sf Vacancy: 17.0% Asking Rate: $26.89 NNN New Construction: 744,149 sf Multi-Tenant Properties Total Inventory: 87,915,425 sf Total # of Buildings: 838 Absorption: (270,325) Vacancy: 21.4% Asking Rate: $26.90  
MARKET STATS BY BUILDING CLASS (Multi and Single Tenant)
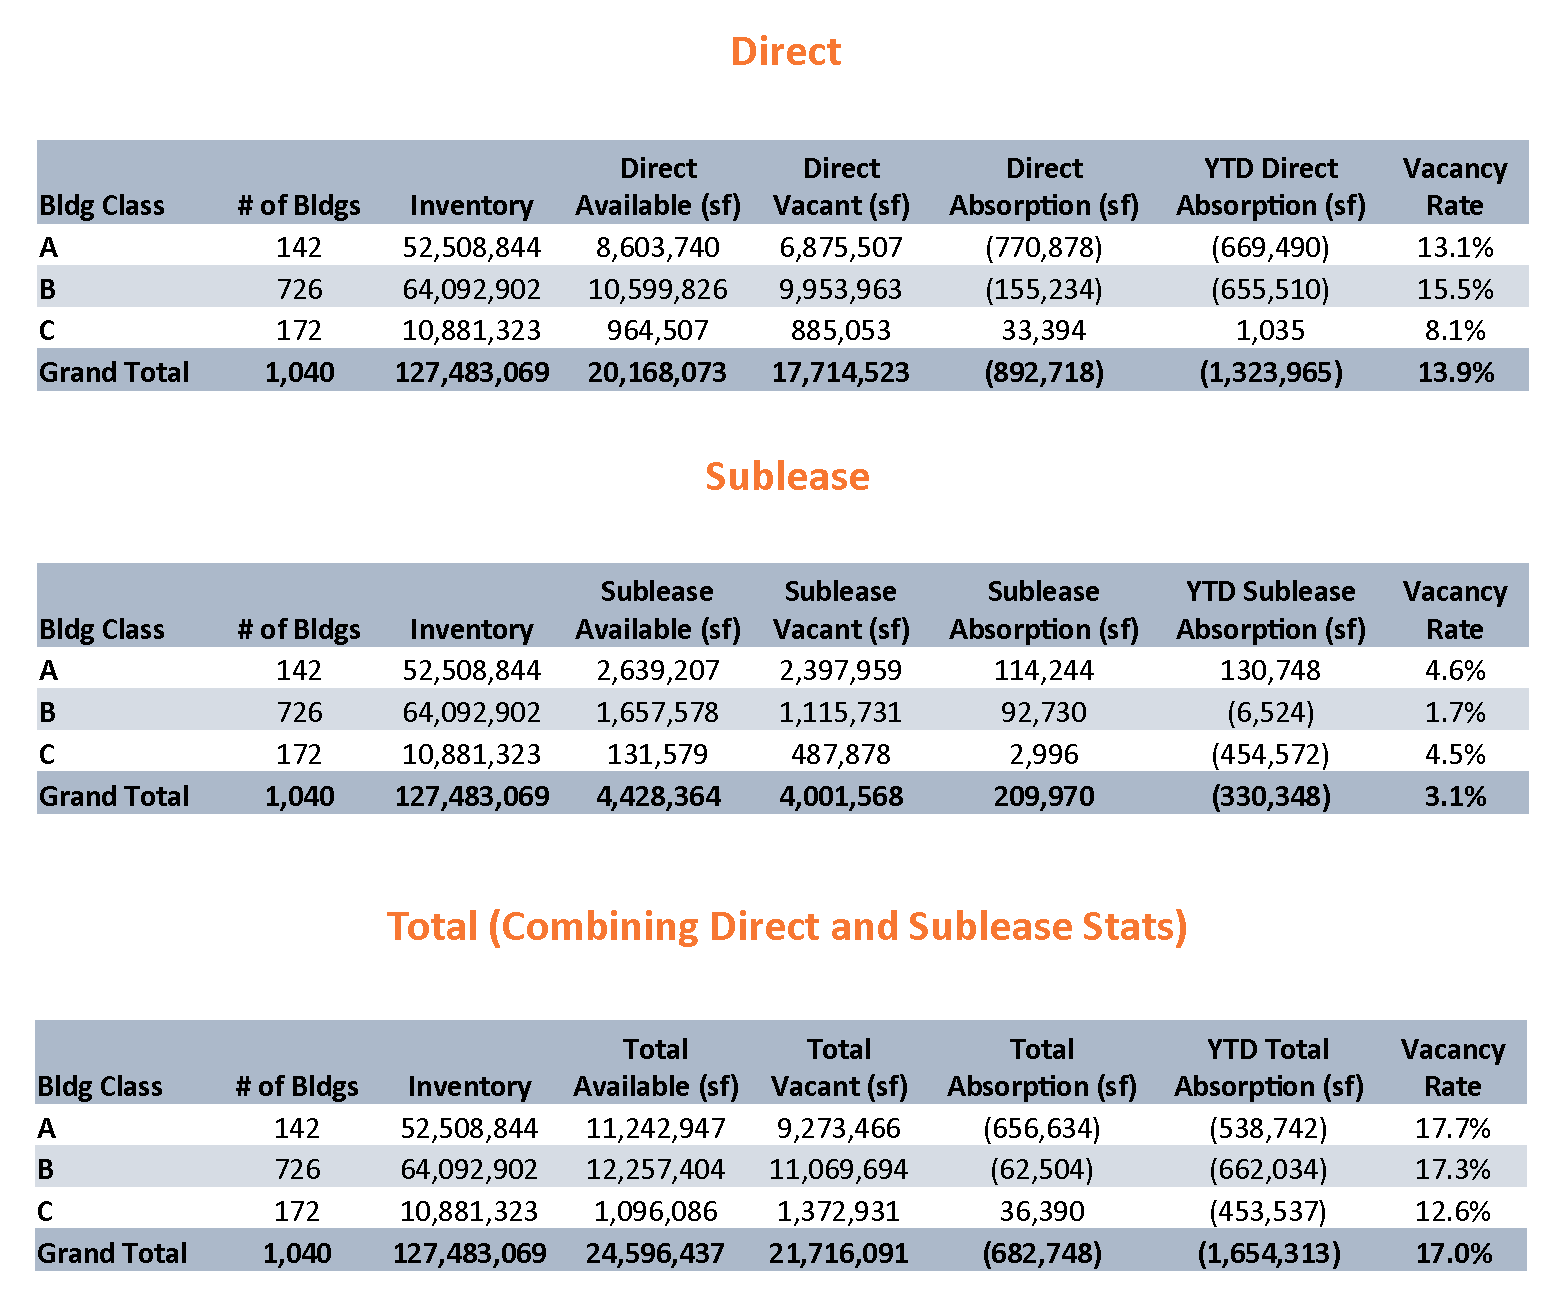
Q1 2023 Mpls-St Paul Office Market Stats by Building Class
ABSORPTION & VACANCY RATE (Multi and Single Tenant)
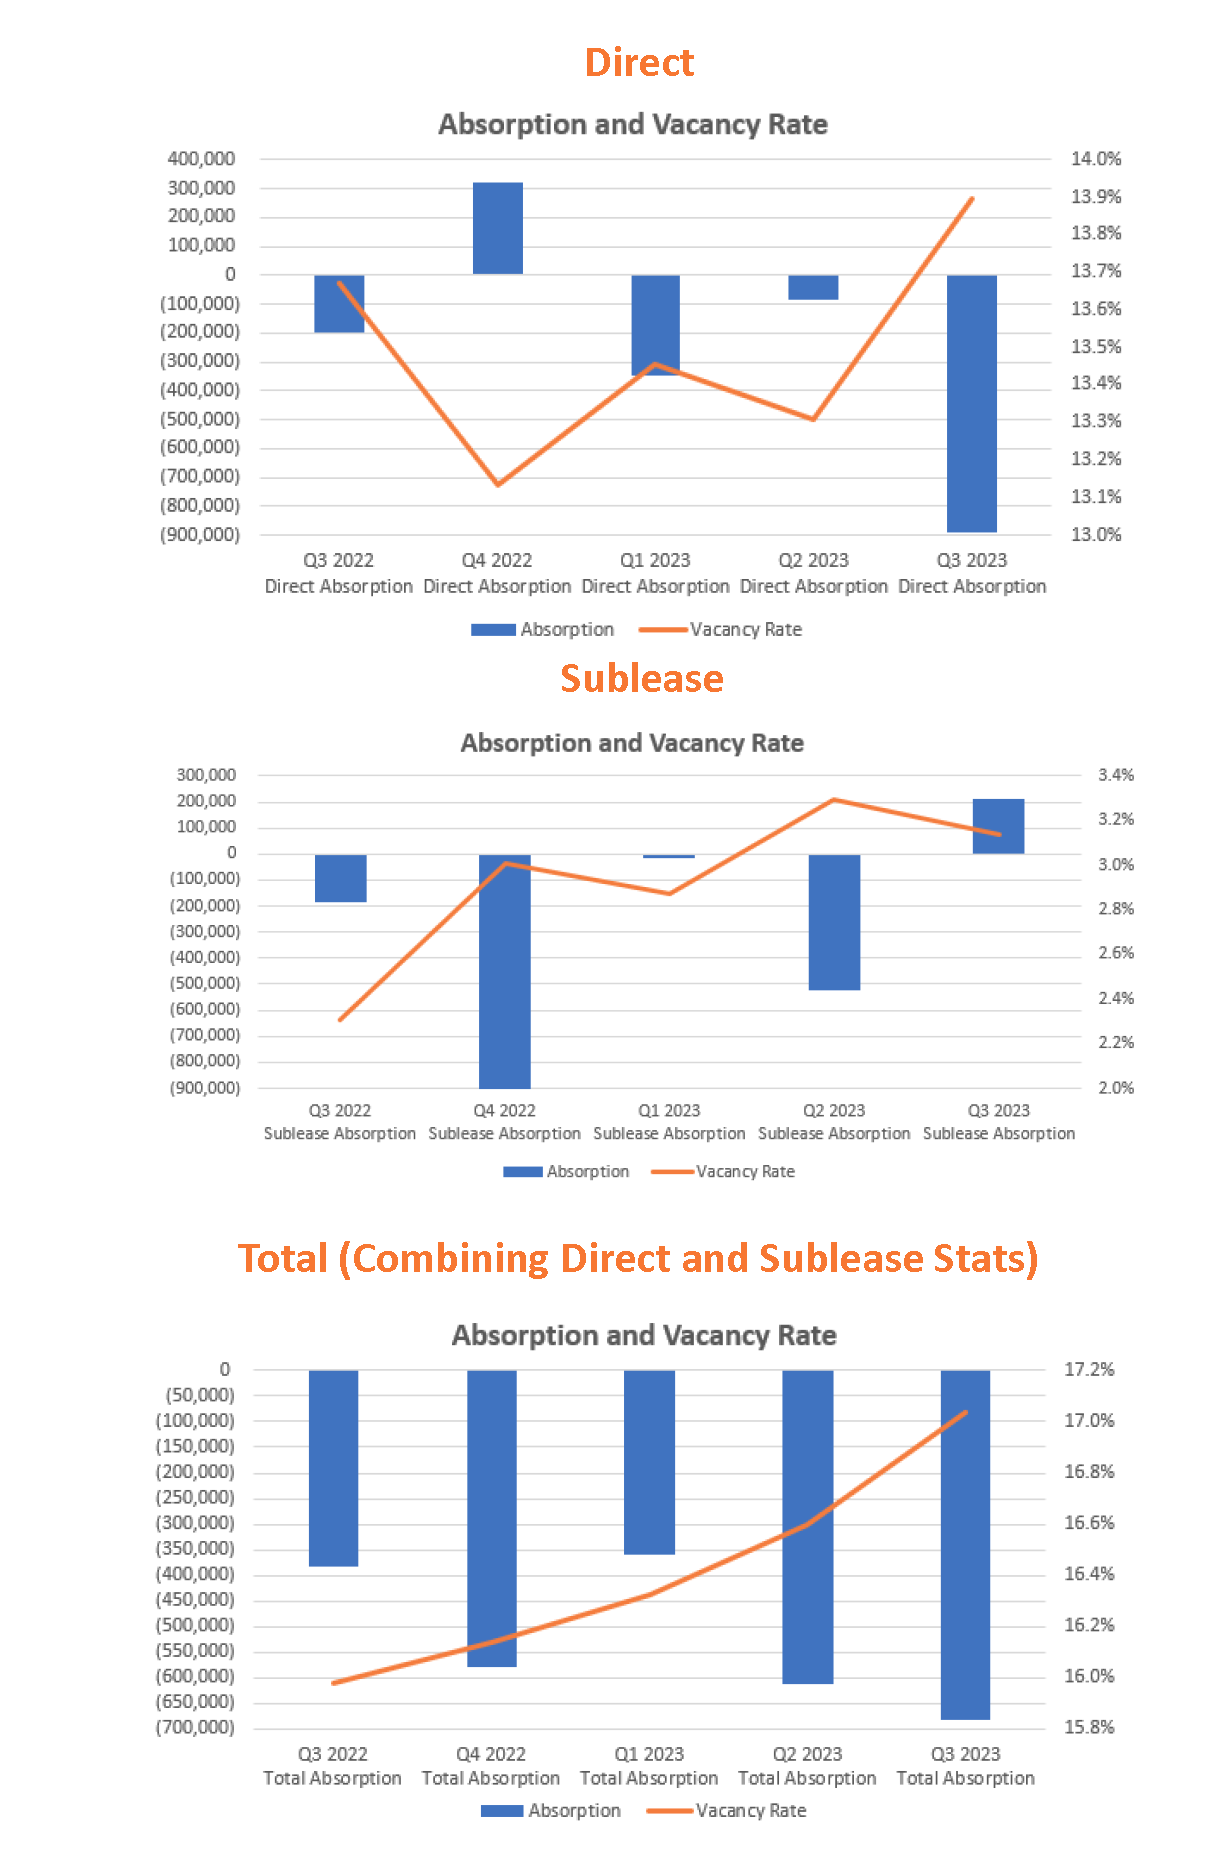
Q1 2023 Mpls-St Paul Office Absorption & Vacancy Rate
MARKET STATISTICS BY MARKET (Direct Multi and Single Tenant)
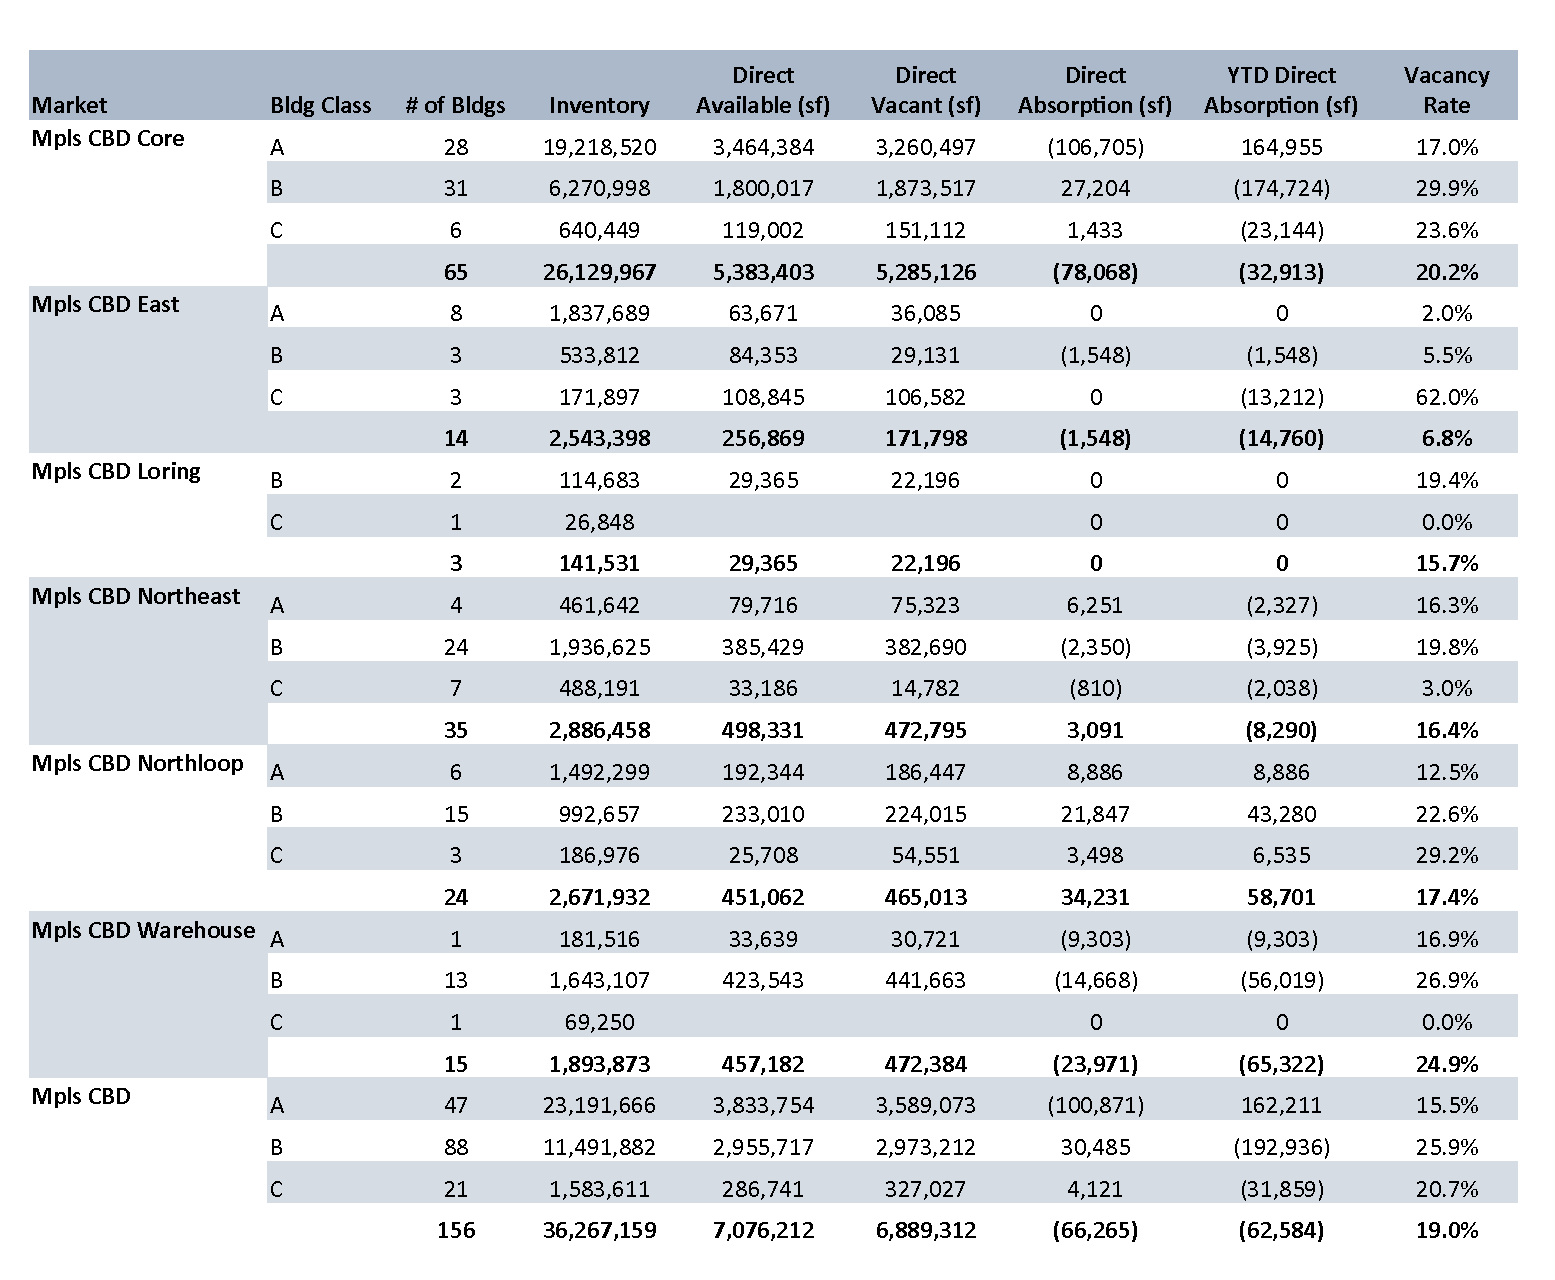
Q1 2023 Mpls-St Paul Office Market Stats by Market
Q1 2023 Mpls-St Paul Office Market Stats by Market Cont.
Q1 2023 Mpls-St Paul Office Market Stats by Market - Graph
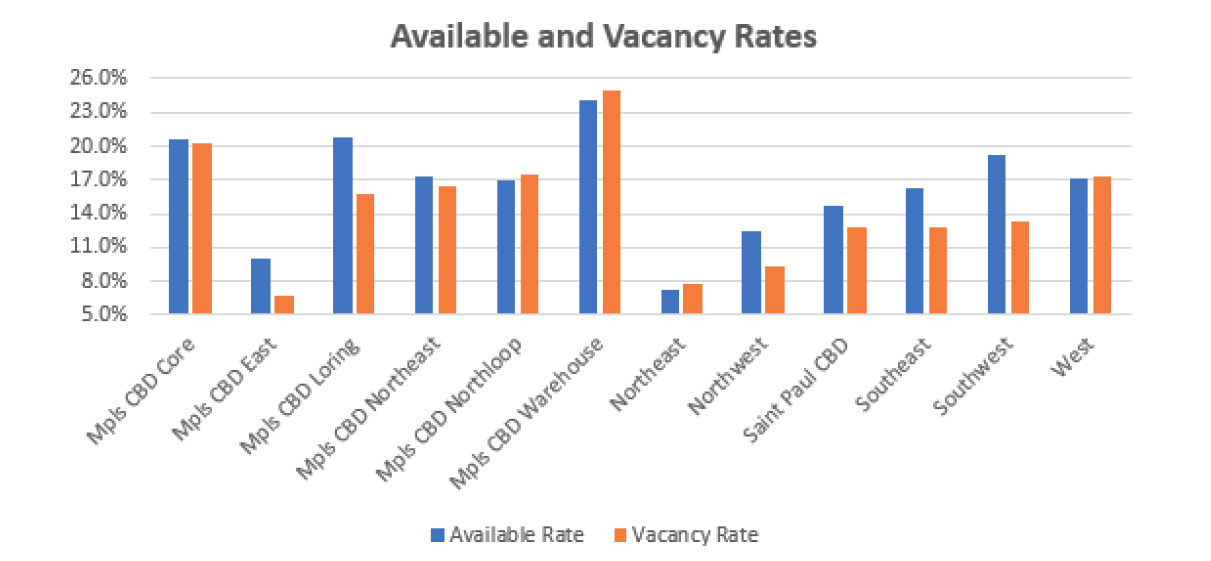
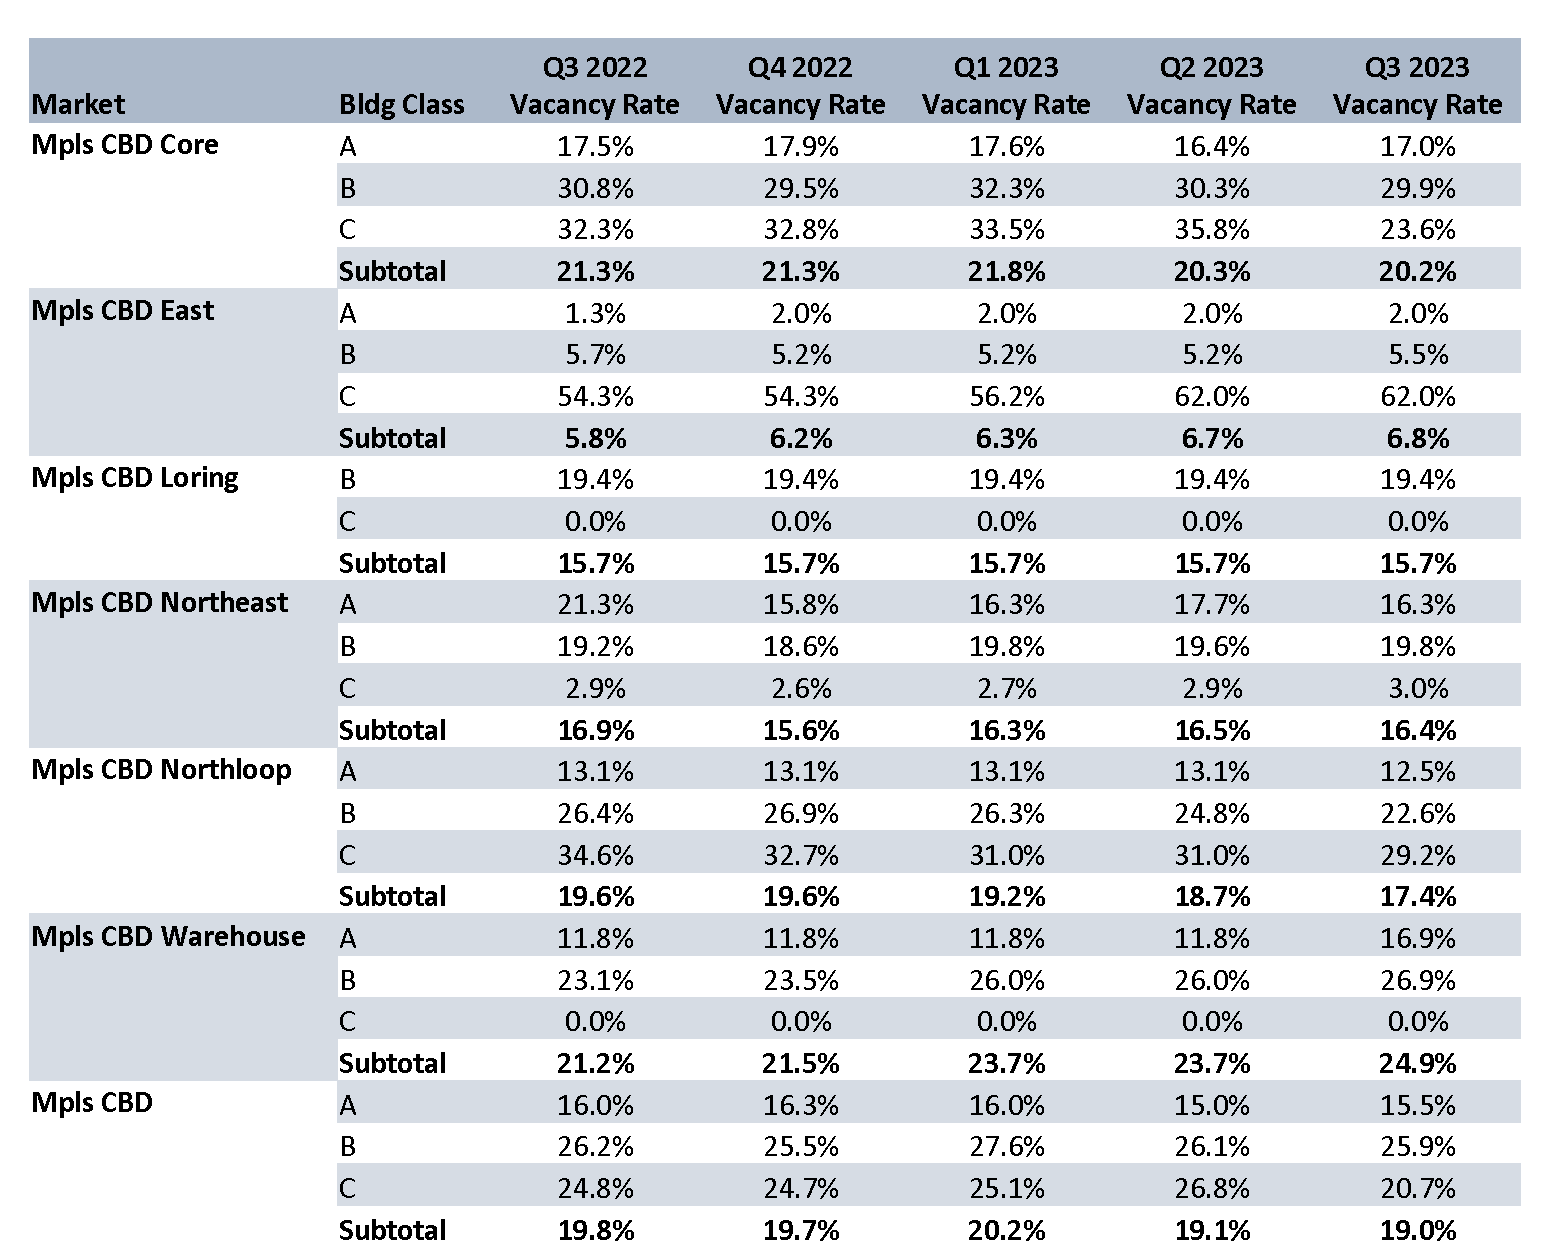
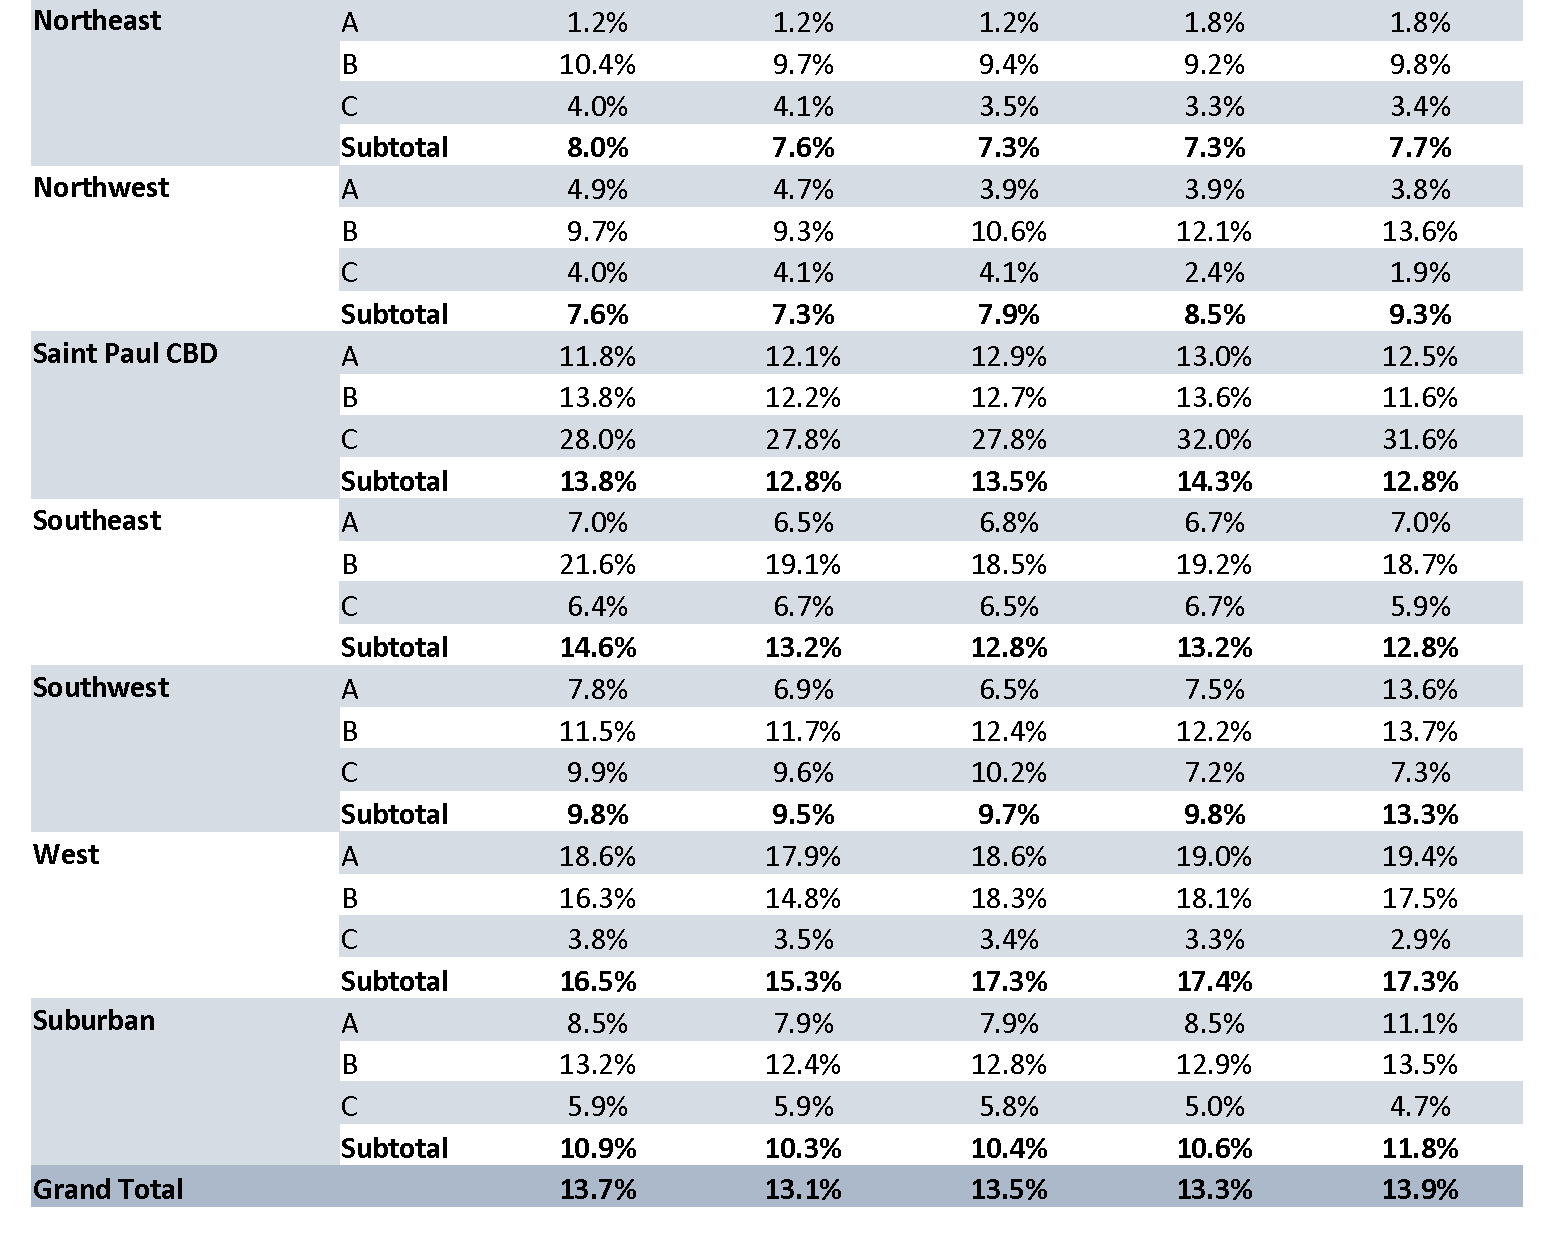
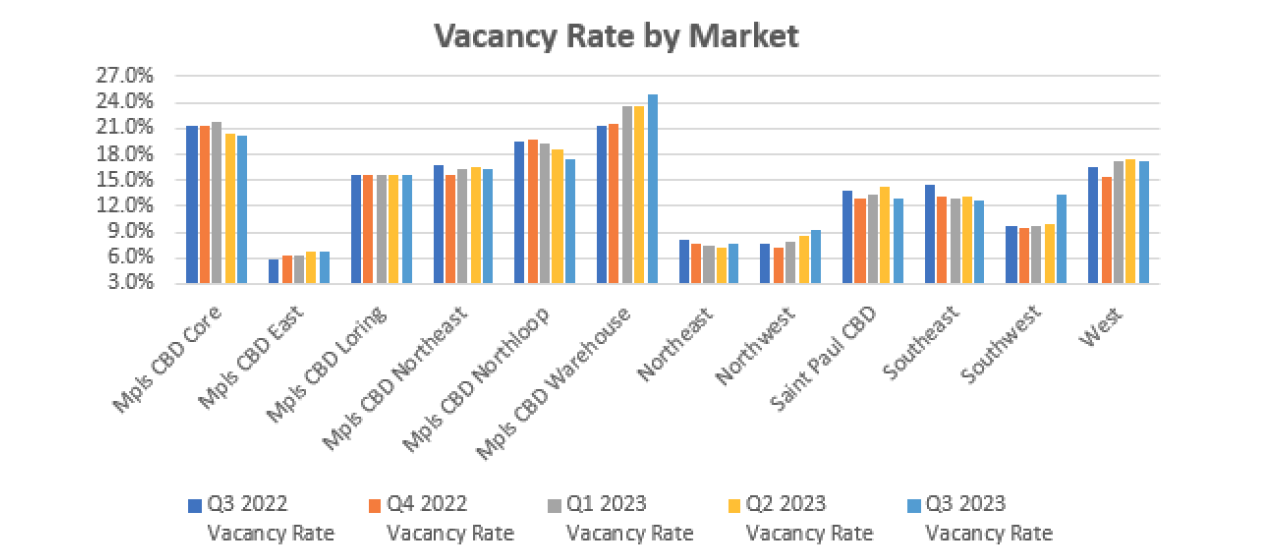
VACANCY RATES BY MARKET (Direct Multi and Single Tenant)
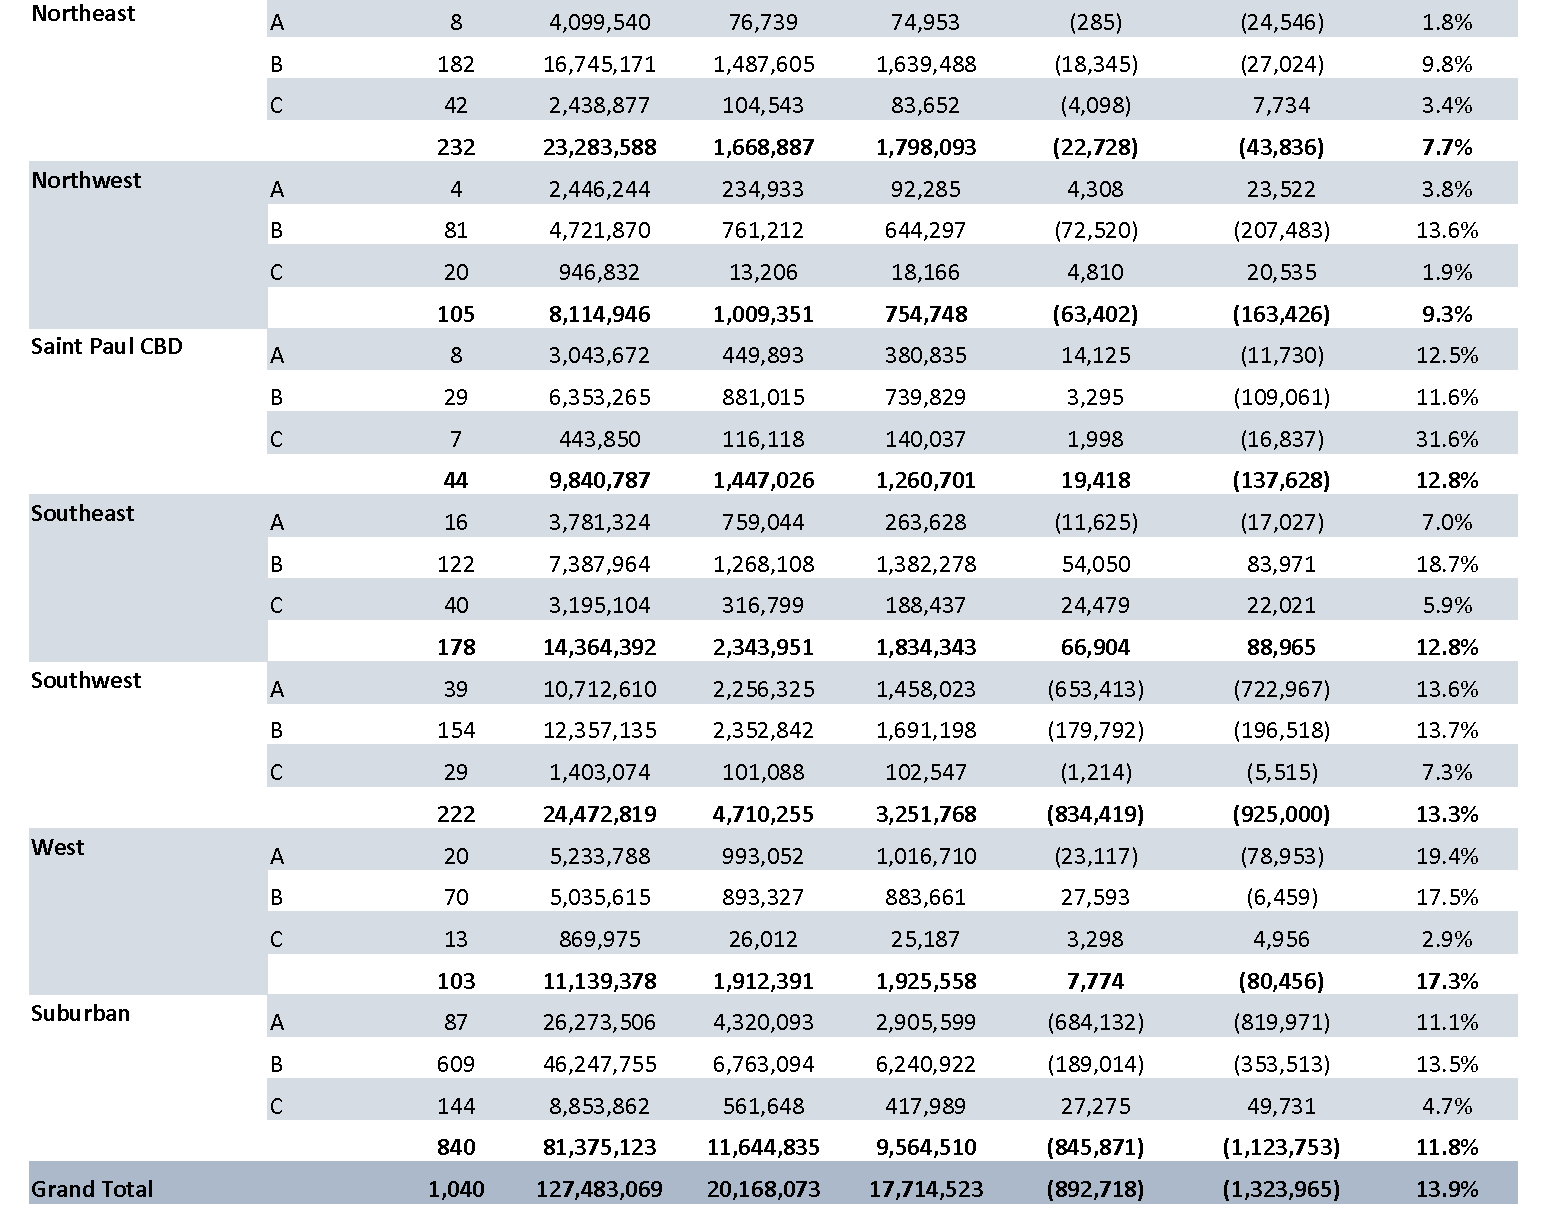
Q1 2023 Mpls-St Paul Office Vacancy Rates by Market
Q1 2023 Mpls-St Paul Office Vacancy Rates by Market Cont.
Q1 2023 Mpls-St Paul Office Vacancy Rates by Market Graph
VACANCY RATES BY BUILDING CLASS (Multi and Single Tenant)
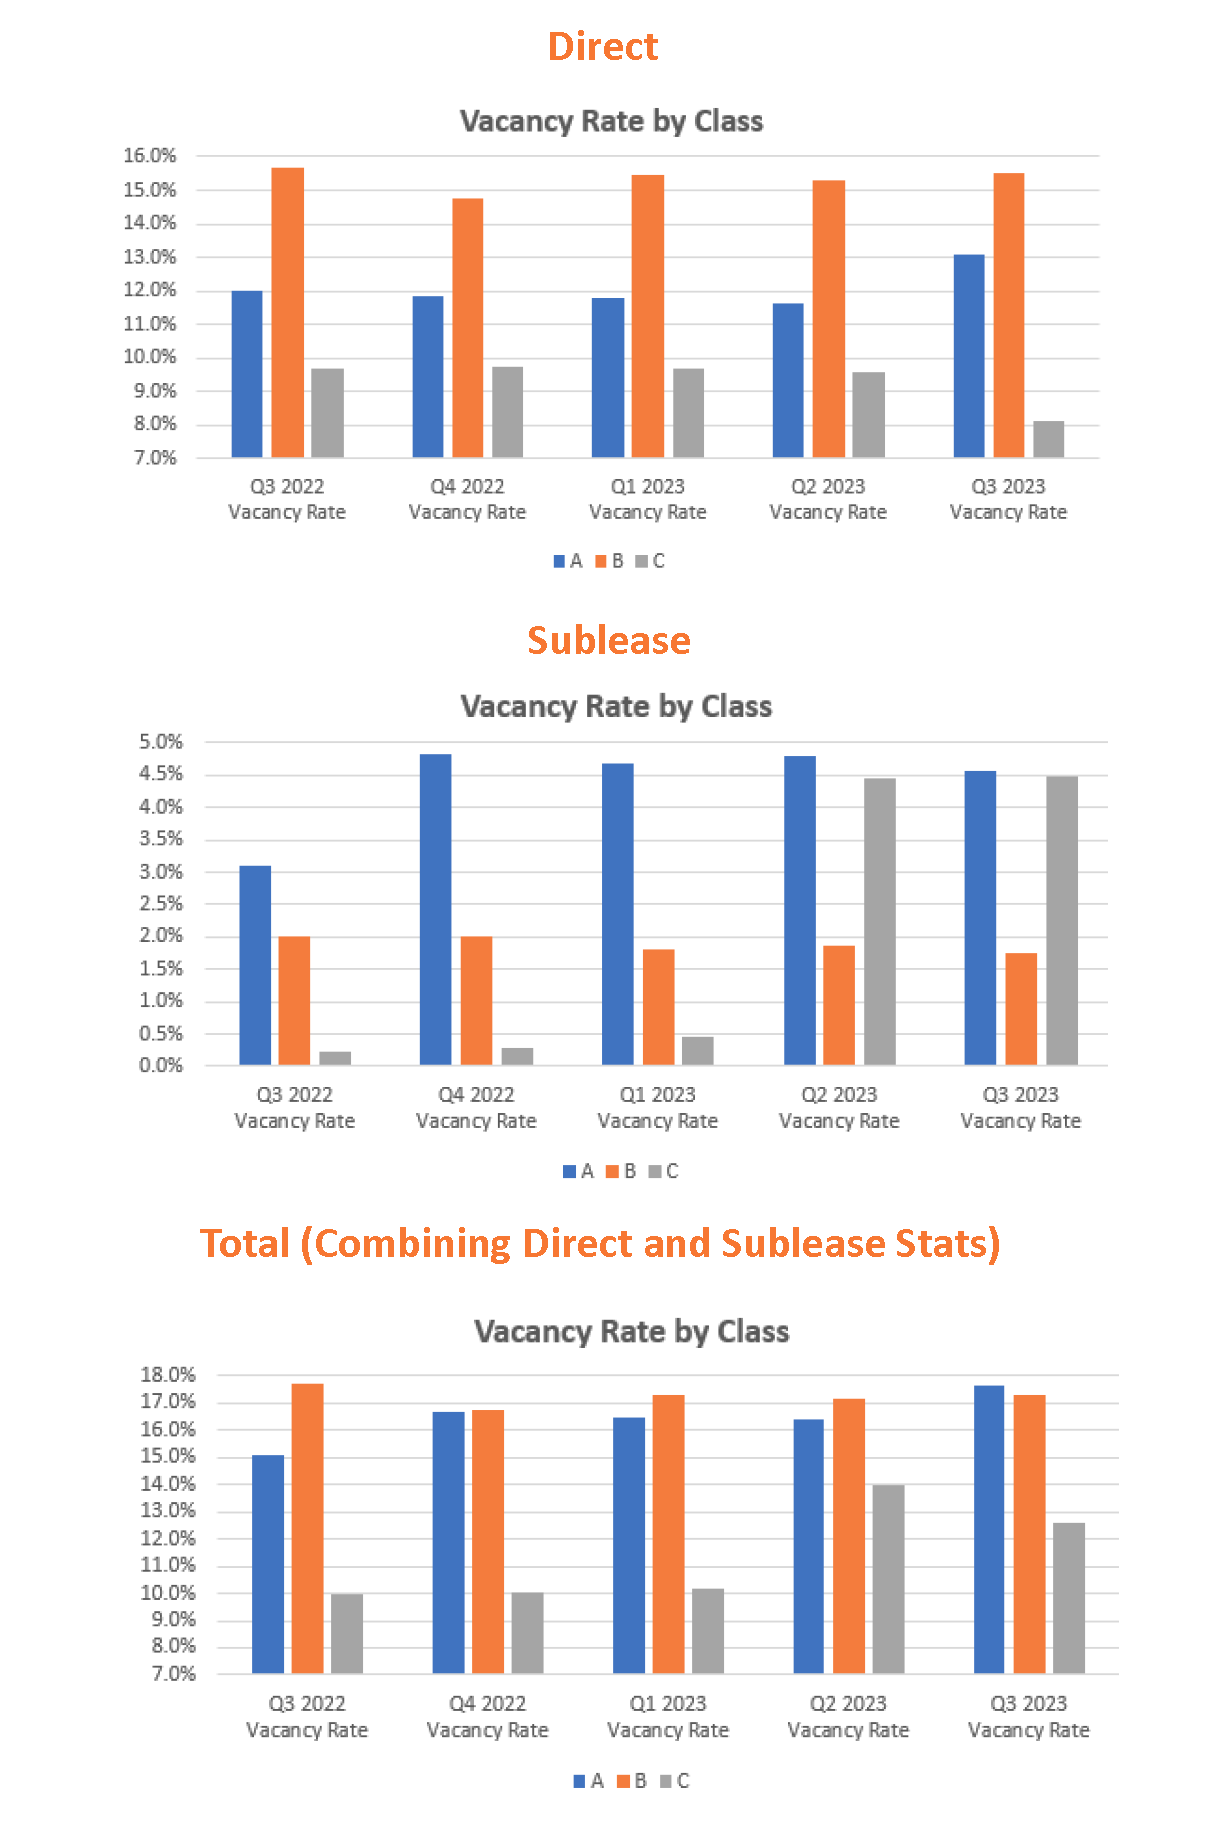
Q1 2023 Mpls-St Paul Office Vacancy Rates by Building Class Graphs
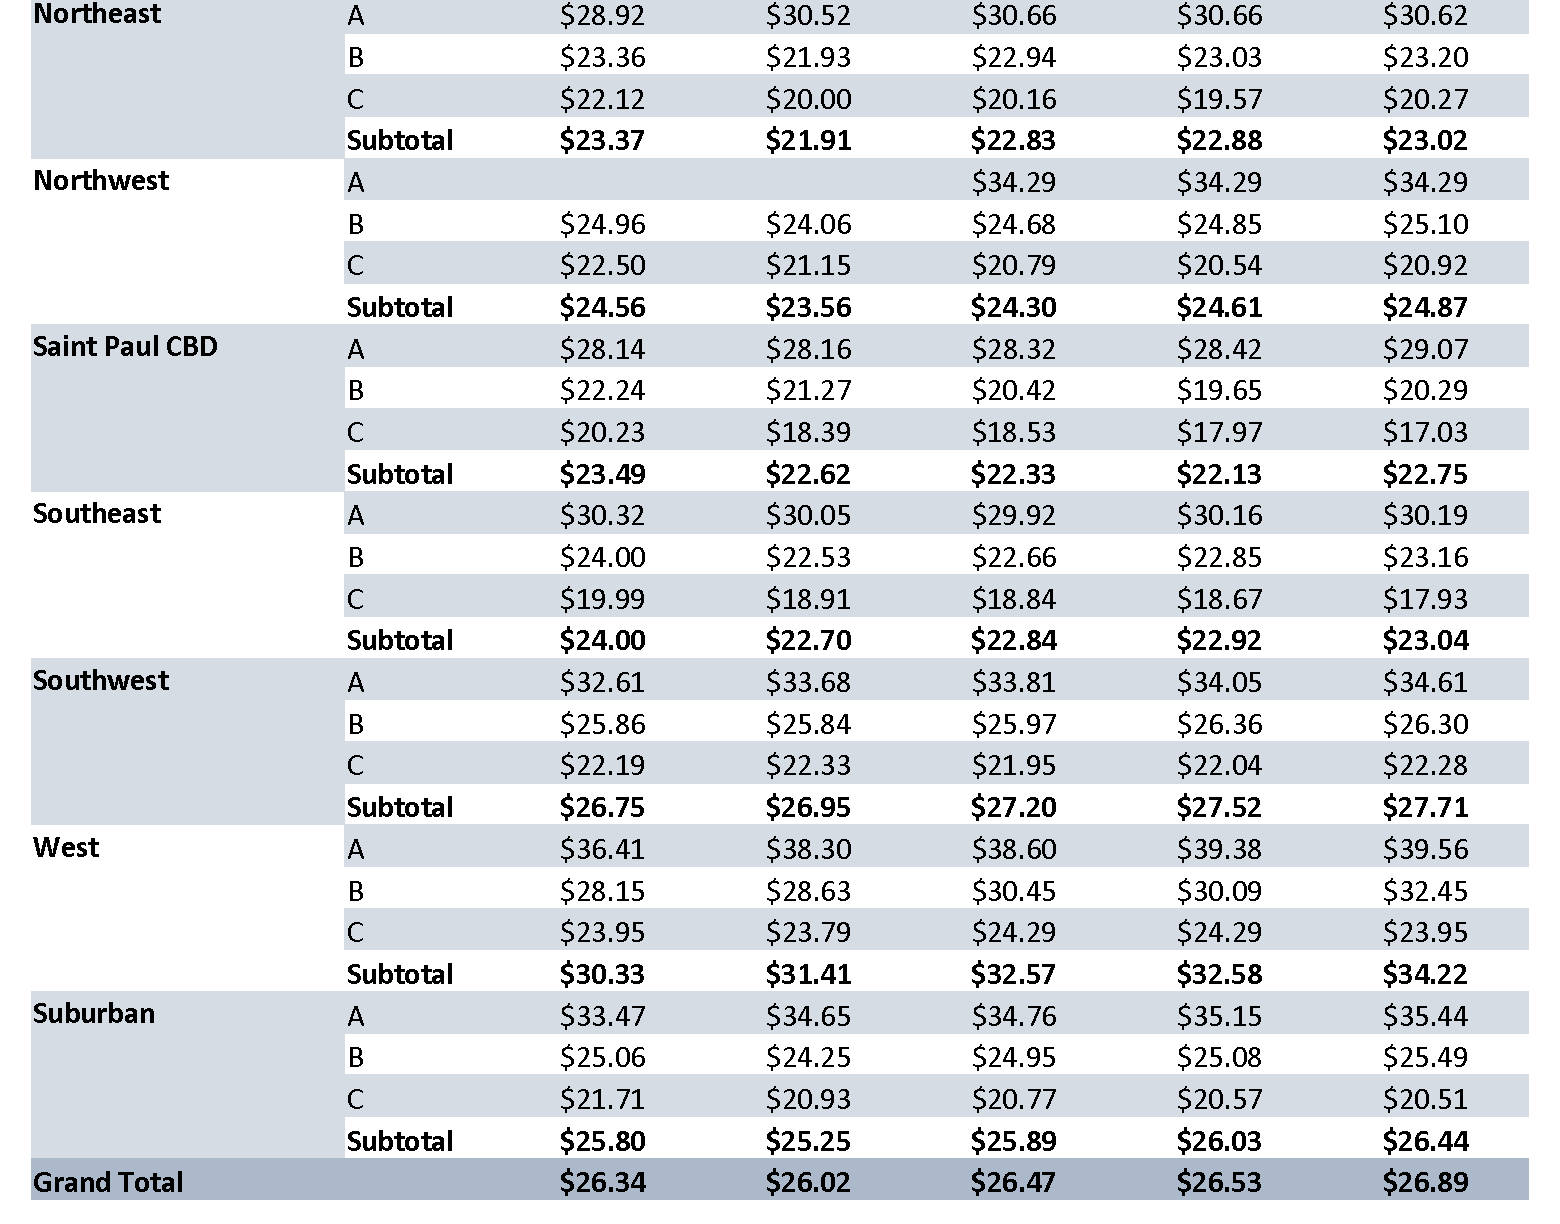
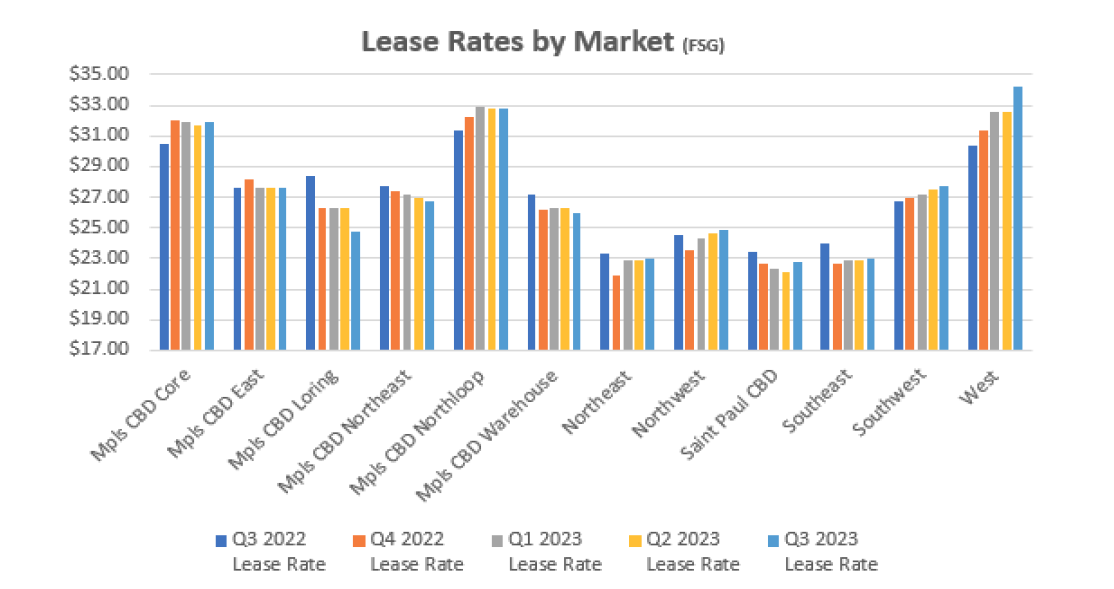
LEASE RATES BY MARKET (Direct Multi and Single Tenant FSG)
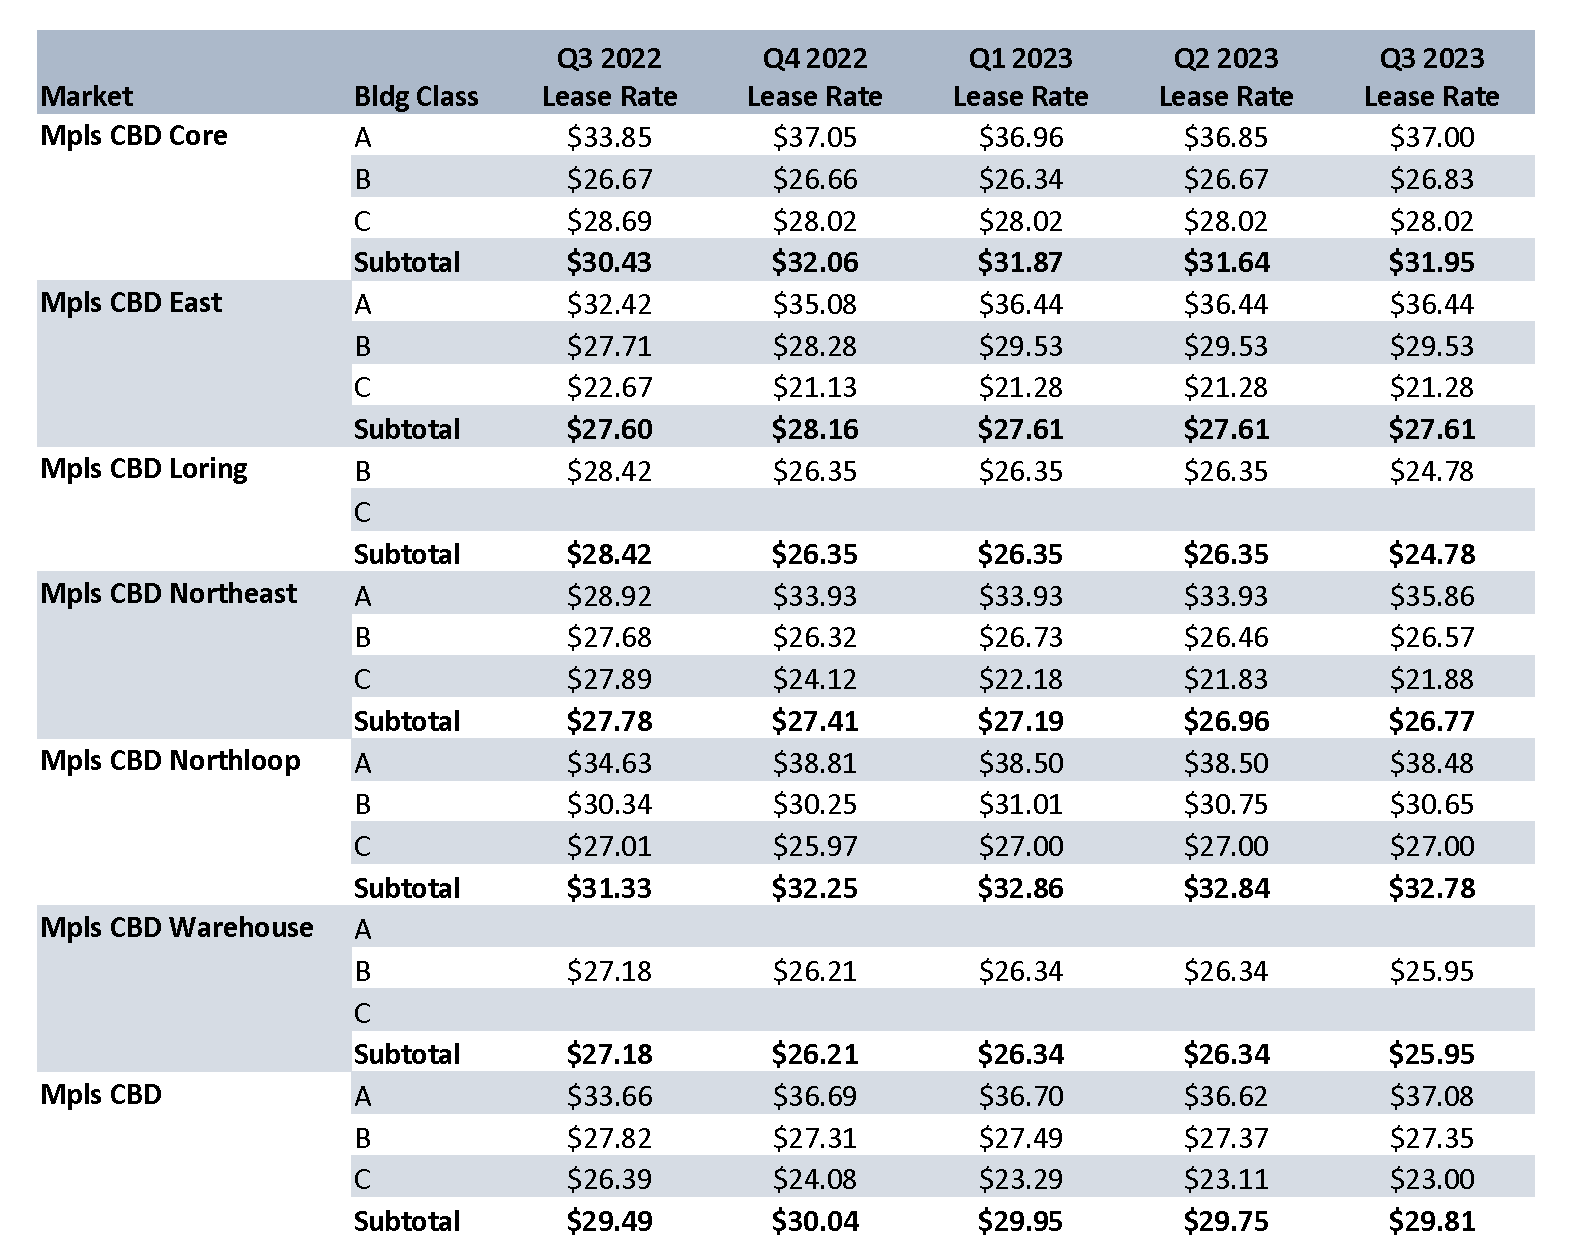
Q1 2023 Mpls-St Paul Office Lease Rates by Market
Q1 2023 Mpls-St Paul Office Lease Rates by Market Cont.
Q1 2023 Mpls-St Paul Office Lease Rates by Market Graph
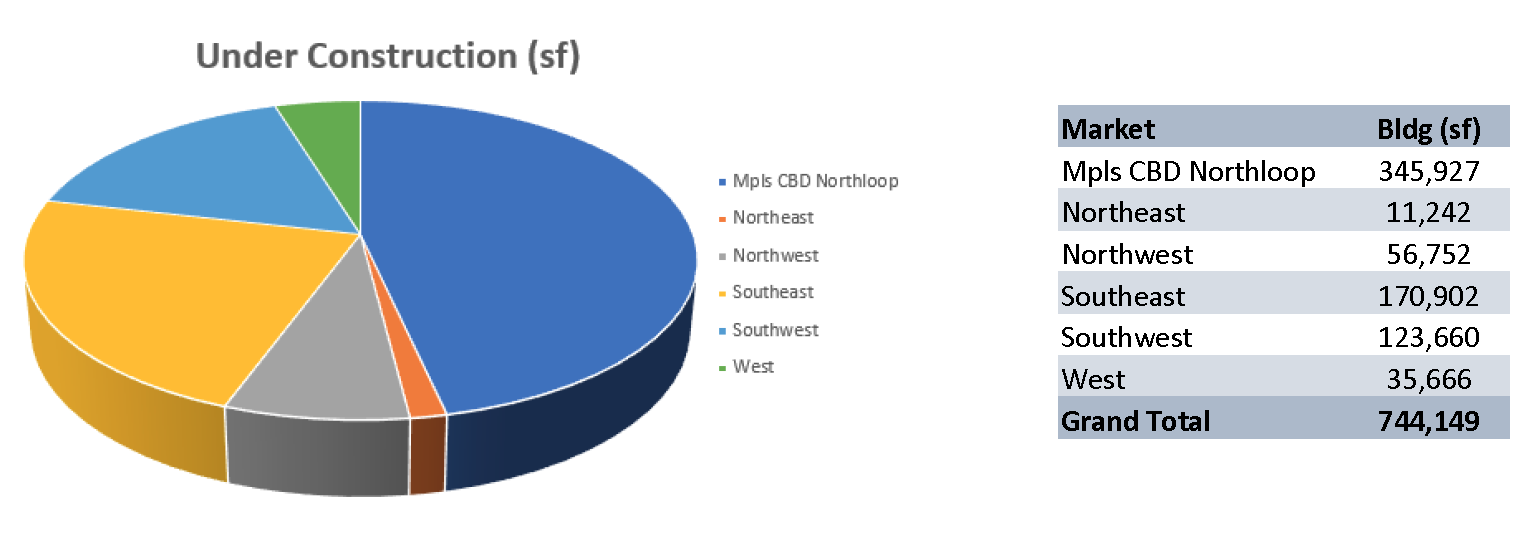
NEW DEVELOPMENTS
Q1 2023 Mpls-St Paul Office Lease Rates by Market Graph
YEAR-TO-DATE DELIVERIES
Q1 2023 Mpls-St Paul Office Year-to-Date Delivered
MARKET MAP
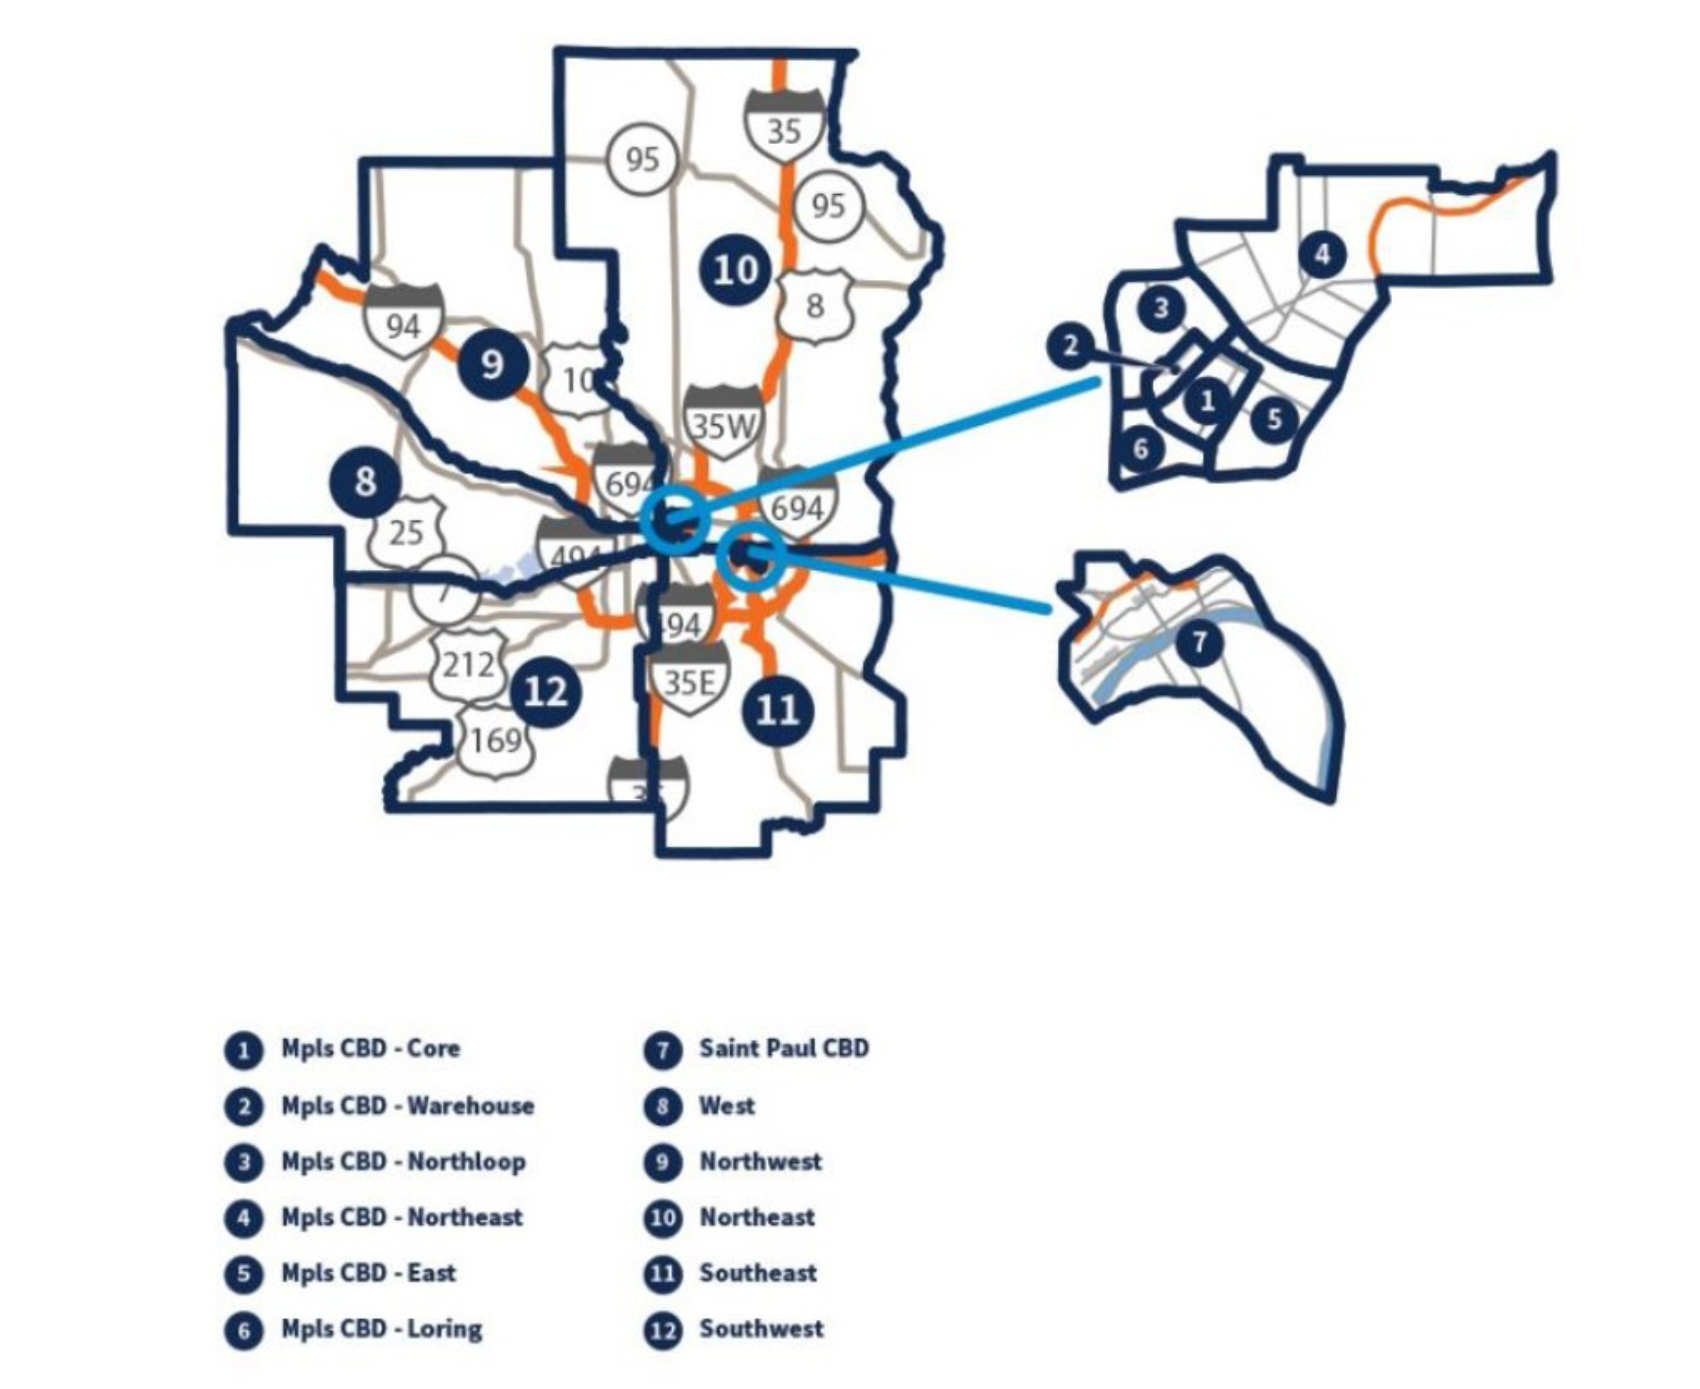
Office Market Map

Market Insight

Get access to all future Office Market Reports below

Office Advisory Experts

Jim Jetland, SIOR

Jim Jetland, SIOR

Principal

Nancy Powell

Nancy Powell

Vice President

Katie Trevena

Katie Trevena

Vice President

News

Q2 2024 Minneapolis-St. Paul Industrial Market Summary

Q2 2024 Minneapolis-St. Paul Industrial Market Summary

MARKET INSIGHTQ2 2024 Minneapolis-St. Paul Industrial Market SummaryForte's Vice President - Advisory, John Young, provides insight to the Twin Cities industrial market report recently released by MNCAR/REDI. Vacancy rates for industrial space are on the rise,...

Q2 2024 Minneapolis-St. Paul Office Market Summary

Q2 2024 Minneapolis-St. Paul Office Market Summary

MARKET INSIGHTQ2 2024 Minneapolis-St. Paul Office Market SummaryForte's Ericka Miller, Vice President Real Estate Advisory, provides insight to the Twin Cities office market report recently released by MNCAR/REDI. Low unemployment rates can often align with a strong...

Q1 2024 Minneapolis-St Paul Office Market Summary

Q1 2024 Minneapolis-St Paul Office Market Summary

MARKET INSIGHTQ1 2024 Minneapolis-St. Paul Office Market SummaryForte Principal, Jim Jetland, provides insight to the Twin Cities office market report recently released by MNCAR/REDI. While there are a few bright spots with the Twin Cities Office Market the general...

Loading...