(952) 854-8290 info@forterep.com

MARKET INSIGHT POST

Q2-2023 Minneapolis-St. Paul Office Market Update

MSP Office Market Update
Q2-2023 Industrial Market Report created by Minnesota Commercial Real Estate Association. For more information, you can reach them at: www.mncar.org
Q3 2021 Employment Rates
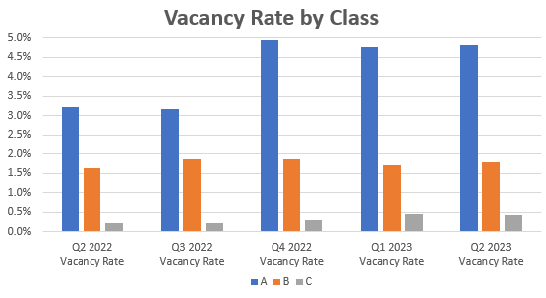
Forte Principal, Jim Jetland lends insight to the Twin Cities office market report recently released by MNCAR/REDI. The Twin Cities office market continues to be challenged with rising vacancy, over-all negative absorption, and a continuing increase in available sublease space coming to the market. The Class B and C buildings suffered the most in Q2 while Class A buildings had the most improvement and remains the most active class in the Twin Cities office market. One silver lining to an otherwise challenged sector is an increase in the number of closed transactions, including direct leases and renewals in Q2. While most tenants have made the decision to reduce their office footprint the fact that real estate decisions and commitments are being made is a positive sign and hopefully an indicator of better things ahead for the local office market.  

Q2-2023 Office Market Update

ECONOMIC OVERVIEW:
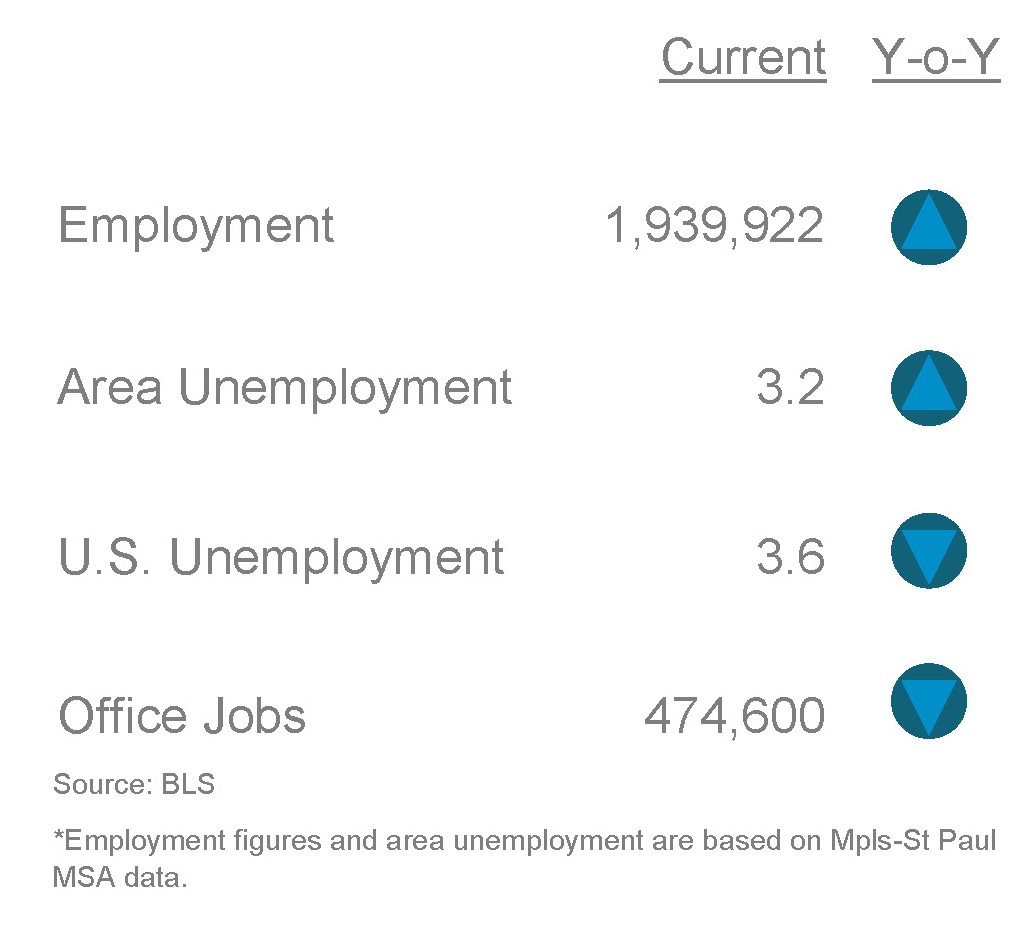
According to the Bureau of Labor Statistics (BLS), the unemployment rate for the Mpls-St Paul metropolitan statistical area (MSA) increased 80 basis points to 2.9% for May 2023 from 2.1% for May 2022. The unemployment rate for the US was at 3.6% in June 2023 which is the same as last year. State of Minnesota unemployment rate was 2.9%. The Mpls-St Paul MSA saw an increase in job growth but office decreased in job growth in professional, financial and information with 6,000 during the same period.
MARKET OVERVIEW:
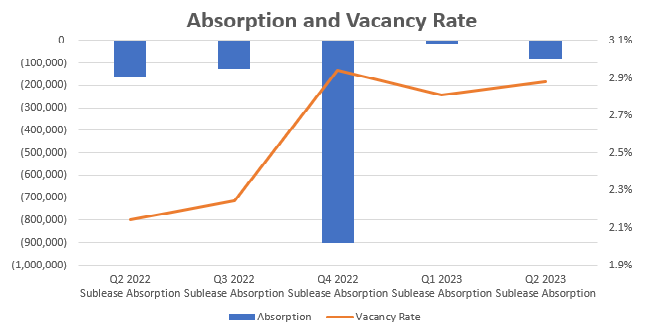
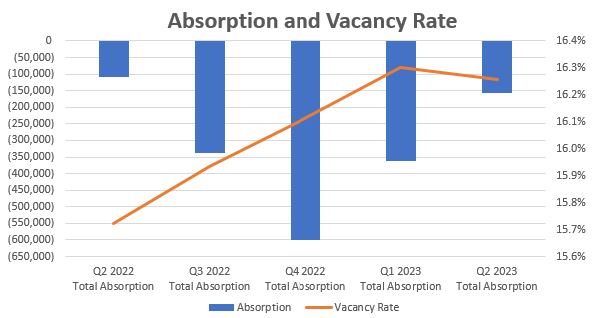
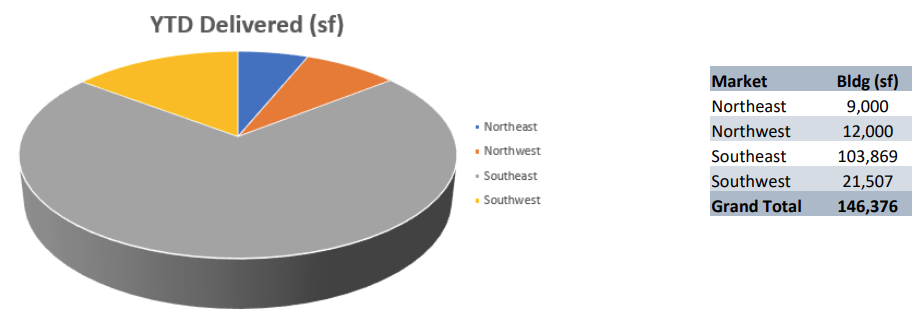
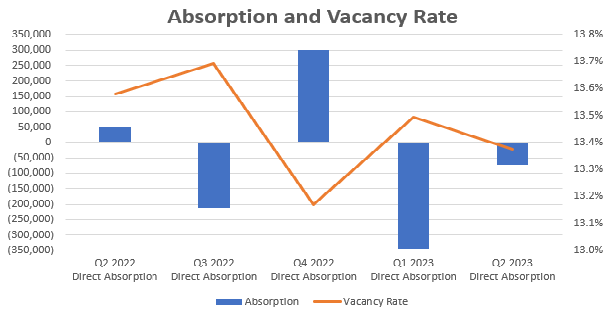
The Mpls-St Paul office market, consisting of 128.6 msf of space in seven metro counties. This region posted (155,500) sf of negative absorption for Q2 2023 and shows an overall vacancy rate of 16.3% for all properties. This quarter showed (73,500) sf of direct negative absorption while subleases accounted for (81,900) sf negative absorption. Multi-tenant only properties posted 21.4% vacancy with (177,000) sf negative absorption. There was (95,000) sf negative absorption for direct space, and (81,900) sf negative absorption for subleases. During Q2 2023 there were 14 construction projects throughout the market totaling 816,000. Seven properties have been delivered YTD with 146,000 sf.
MARKET HIGHLIGHTS:
During Q2 2023, the market experienced over 1.164 msf of leasing activity in 294 transactions. For direct leasing, Mpls CBD markets posted 167,000 sf positive absorption. Fredrickson and Byron led the way by leasing 158,000 sf as they vacated 200,000 sf that US Bank will absorb. The suburban markets posted (145,000) sf negative absorption and St. Paul CBD posted (95,000) sf negative absorption. Sixty one properties with 779,000 sf sold for $79 million this quarter.  
MPLS-ST. PAUL AREA EMPLOYMENT STATS:
Q1 2023 Mpls-St Paul Office Employment Stats
MARKET RECAP:
All Properties: Total Inventory: 128,038,586 sf Total # of Buildings: 1,043 Absorption: (155,503) sf Vacancy: 16.3% Asking Rate: $26.55 NNN New Construction: 816,616 sf Multi-Tenant Properties Total Inventory: 88,500,305 sf Total # of Buildings: 842 Absorption: (177,010) Vacancy: 21.4% Asking Rate: $26.57  
MARKET STATS BY BUILDING CLASS (Multi and Single Tenant)
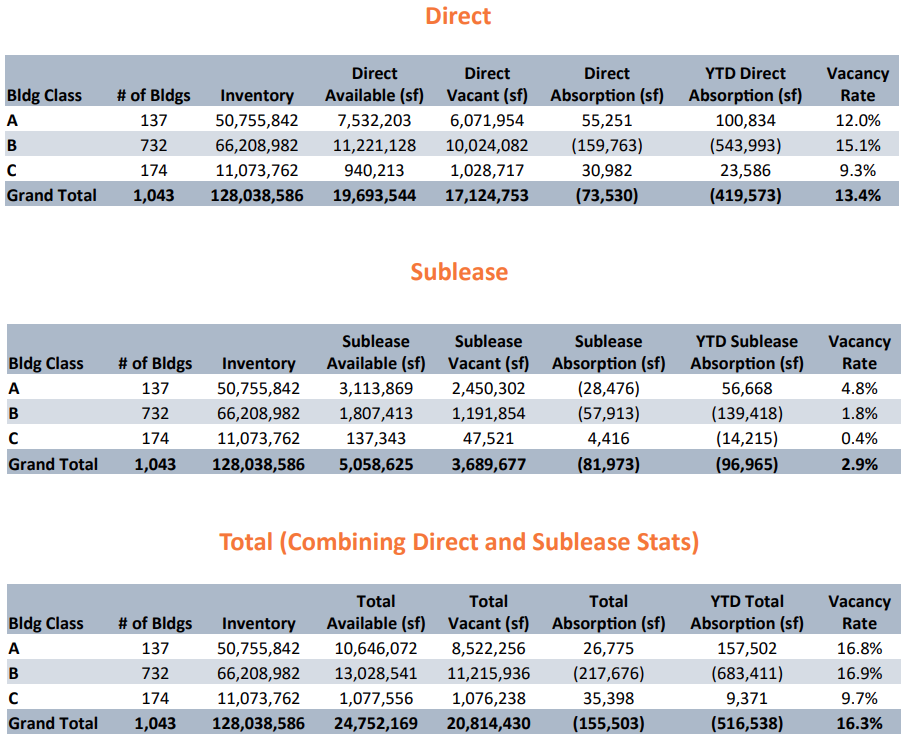
Q1 2023 Mpls-St Paul Office Market Stats by Building Class
ABSORPTION & VACANCY RATE (Multi and Single Tenant)
MARKET STATISTICS BY MARKET (Direct Multi and Single Tenant)
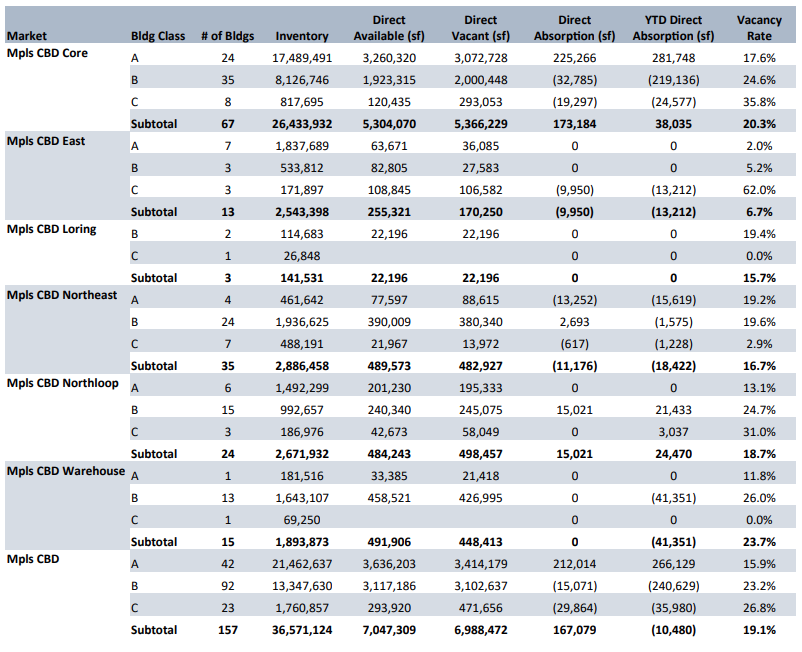
Q1 2023 Mpls-St Paul Office Market Stats by Market
Q1 2023 Mpls-St Paul Office Market Stats by Market Cont.
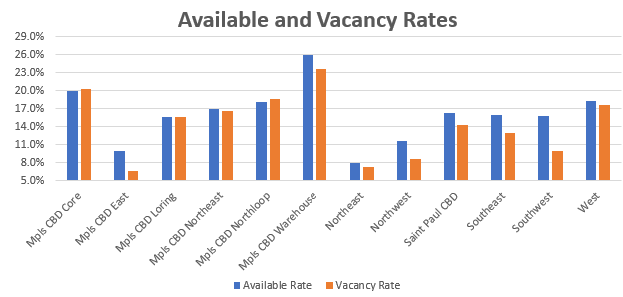
Q1 2023 Mpls-St Paul Office Market Stats by Market - Graph
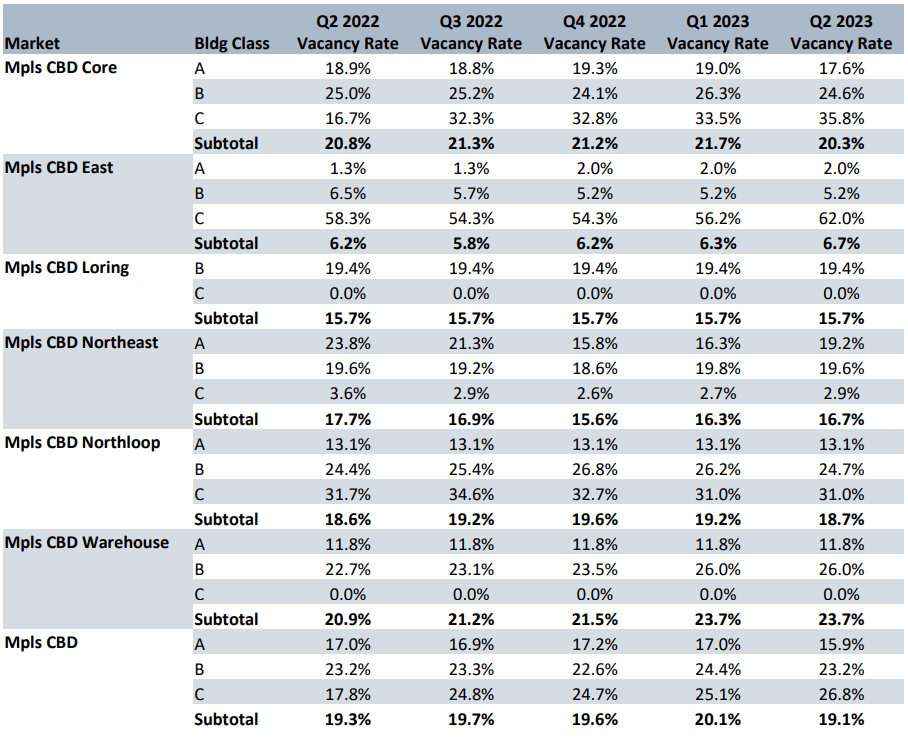
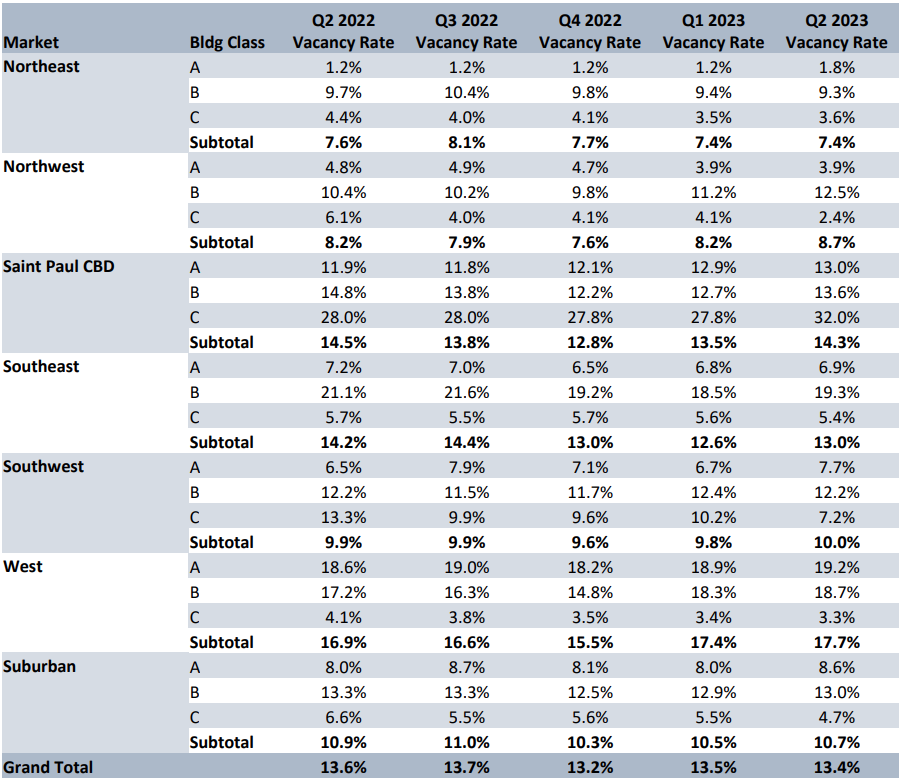
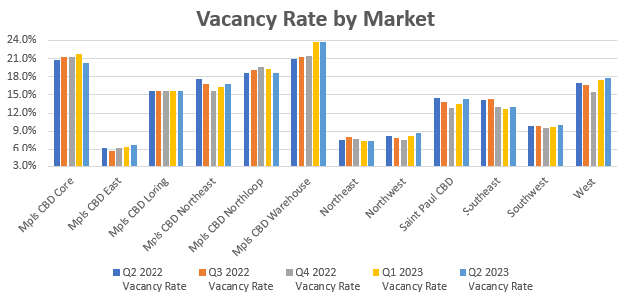
VACANCY RATES BY MARKET (Direct Multi and Single Tenant)
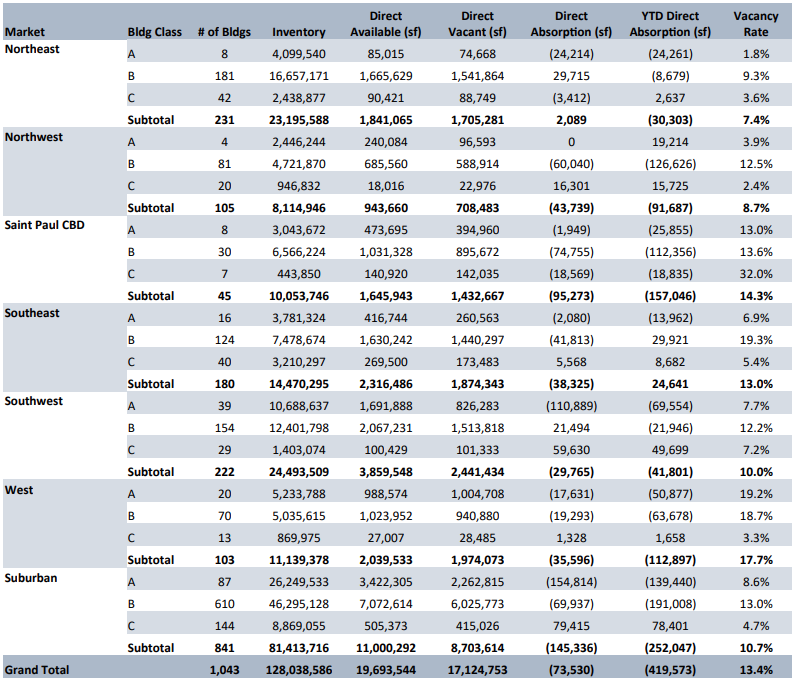
Q1 2023 Mpls-St Paul Office Vacancy Rates by Market
Q1 2023 Mpls-St Paul Office Vacancy Rates by Market Cont.
Q1 2023 Mpls-St Paul Office Vacancy Rates by Market Graph
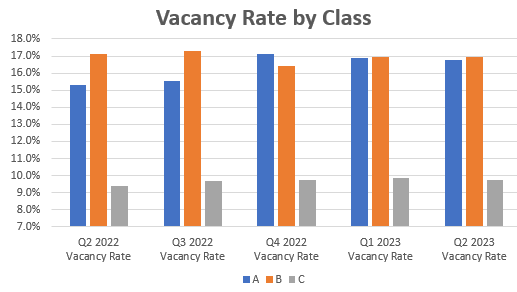
VACANCY RATES BY BUILDING CLASS (Multi and Single Tenant)
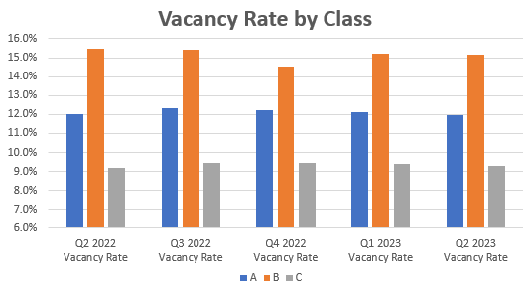
Q1 2023 Mpls-St Paul Office Vacancy Rates by Building Class Graphs
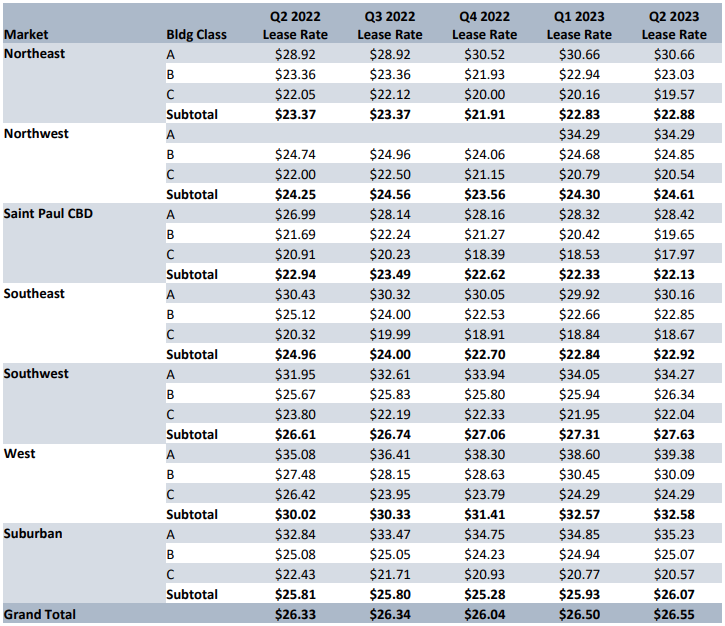
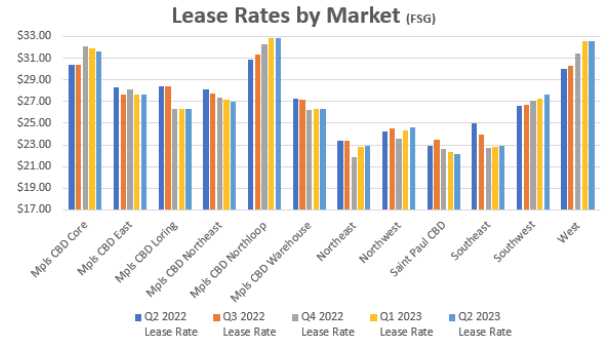
LEASE RATES BY MARKET (Direct Multi and Single Tenant FSG)
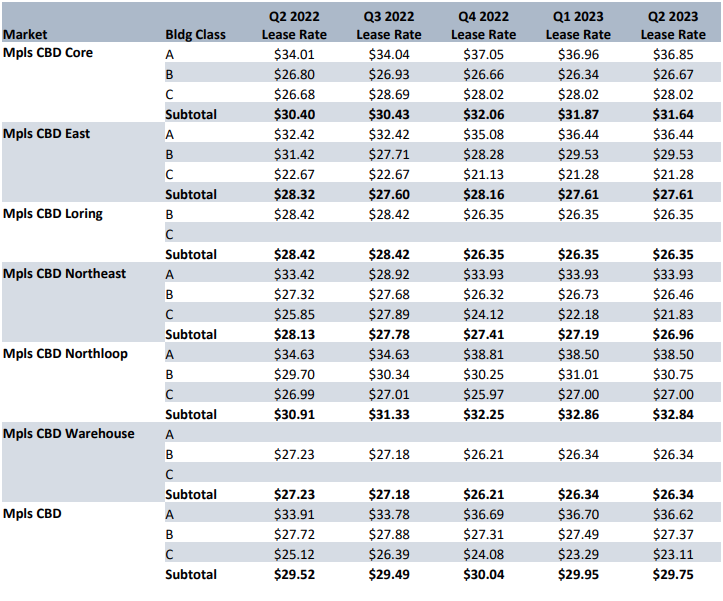
Q1 2023 Mpls-St Paul Office Lease Rates by Market
Q1 2023 Mpls-St Paul Office Lease Rates by Market Cont.
Q1 2023 Mpls-St Paul Office Lease Rates by Market Graph
NEW DEVELOPMENTS
Q1 2023 Mpls-St Paul Office Lease Rates by Market Graph
YEAR-TO-DATE DELIVERIES
Q1 2023 Mpls-St Paul Office Year-to-Date Delivered
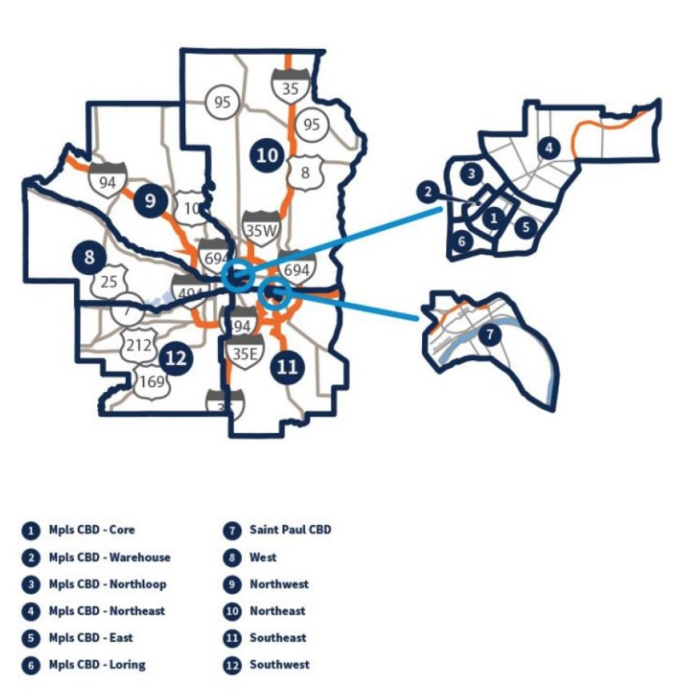
MARKET MAP
Office Market Map

Market Insight

Get access to all future Office Market Reports below

Office Advisory Experts

Jim Jetland, SIOR

Jim Jetland, SIOR

Principal

Nancy Powell

Nancy Powell

Vice President

Katie Trevena

Katie Trevena

Vice President

News

Q2 2024 Minneapolis-St. Paul Industrial Market Summary

Q2 2024 Minneapolis-St. Paul Industrial Market Summary

MARKET INSIGHTQ2 2024 Minneapolis-St. Paul Industrial Market SummaryForte's Vice President - Advisory, John Young, provides insight to the Twin Cities industrial market report recently released by MNCAR/REDI. Vacancy rates for industrial space are on the rise,...

Q2 2024 Minneapolis-St. Paul Office Market Summary

Q2 2024 Minneapolis-St. Paul Office Market Summary

MARKET INSIGHTQ2 2024 Minneapolis-St. Paul Office Market SummaryForte's Ericka Miller, Vice President Real Estate Advisory, provides insight to the Twin Cities office market report recently released by MNCAR/REDI. Low unemployment rates can often align with a strong...

Q1 2024 Minneapolis-St Paul Office Market Summary

Q1 2024 Minneapolis-St Paul Office Market Summary

MARKET INSIGHTQ1 2024 Minneapolis-St. Paul Office Market SummaryForte Principal, Jim Jetland, provides insight to the Twin Cities office market report recently released by MNCAR/REDI. While there are a few bright spots with the Twin Cities Office Market the general...

Loading...