MARKET INSIGHT
Q1 2024 Minneapolis-St. Paul Industrial Market Summary

Forte Senior Vice President – Advisory, Dan Lofgren, provides insight to the Twin Cities industrial market report recently released by MNCAR/REDI.
The Minneapolis/St. Paul industrial market continues to stabilize back to more traditional market norms after reaching historically low vacancy rates in 2022 and 2023. Overall vacancy rate for Q1 2024 was 5.0% compared to 3.4% YE 2022, however, overall absorption was healthy with 932,078 SF of positive absorption in Q1 2024. Although vacancy rates have slightly risen since 2023, Q1 2024 rental rates continue to maintain with overall average lease rates of $11.20/sf and $8.32/sf.
During 2023, 9.1 million square feet of new projects were delivered. We expect the delivery of new speculative development to slow down in 2024 which is demonstrated with YTD deliveries totaling 1,678,035 SF. While interest rates continue to stay elevated, most developers will continue to pause on speculative new construction in 2024 unless more certainty is expected within the capital markets. Areas that remain under scrutiny include Woodbury/Lake Elmo with over a million square feet of spec space and Shakopee with over a million square feet of both existing and new vacancy coming back to the market.
Q1-2024 Minneapolis-St. Paul Industrial Market Summary
MARKET RECAP:
All Properties:
Total Inventory: 293,283,532 sf
Total # of Buildings: 3,285
Absorption: 932,078 sf
Vacancy: 5.0%
Asking Rate Low: $8.32 NNN
Asking Rate High: $11.20 NNN
Under Construction: 3,580,370 sf
Multi-Tenant Properties
Total Inventory: 154,235,407 sf
Total # of Buildings: 1,838
Absorption: 580,411 sf
Vacancy: 7.7%
Asking Rate Low: $8.50
Asking Rate High: $11.41
ECONOMIC OVERVIEW:
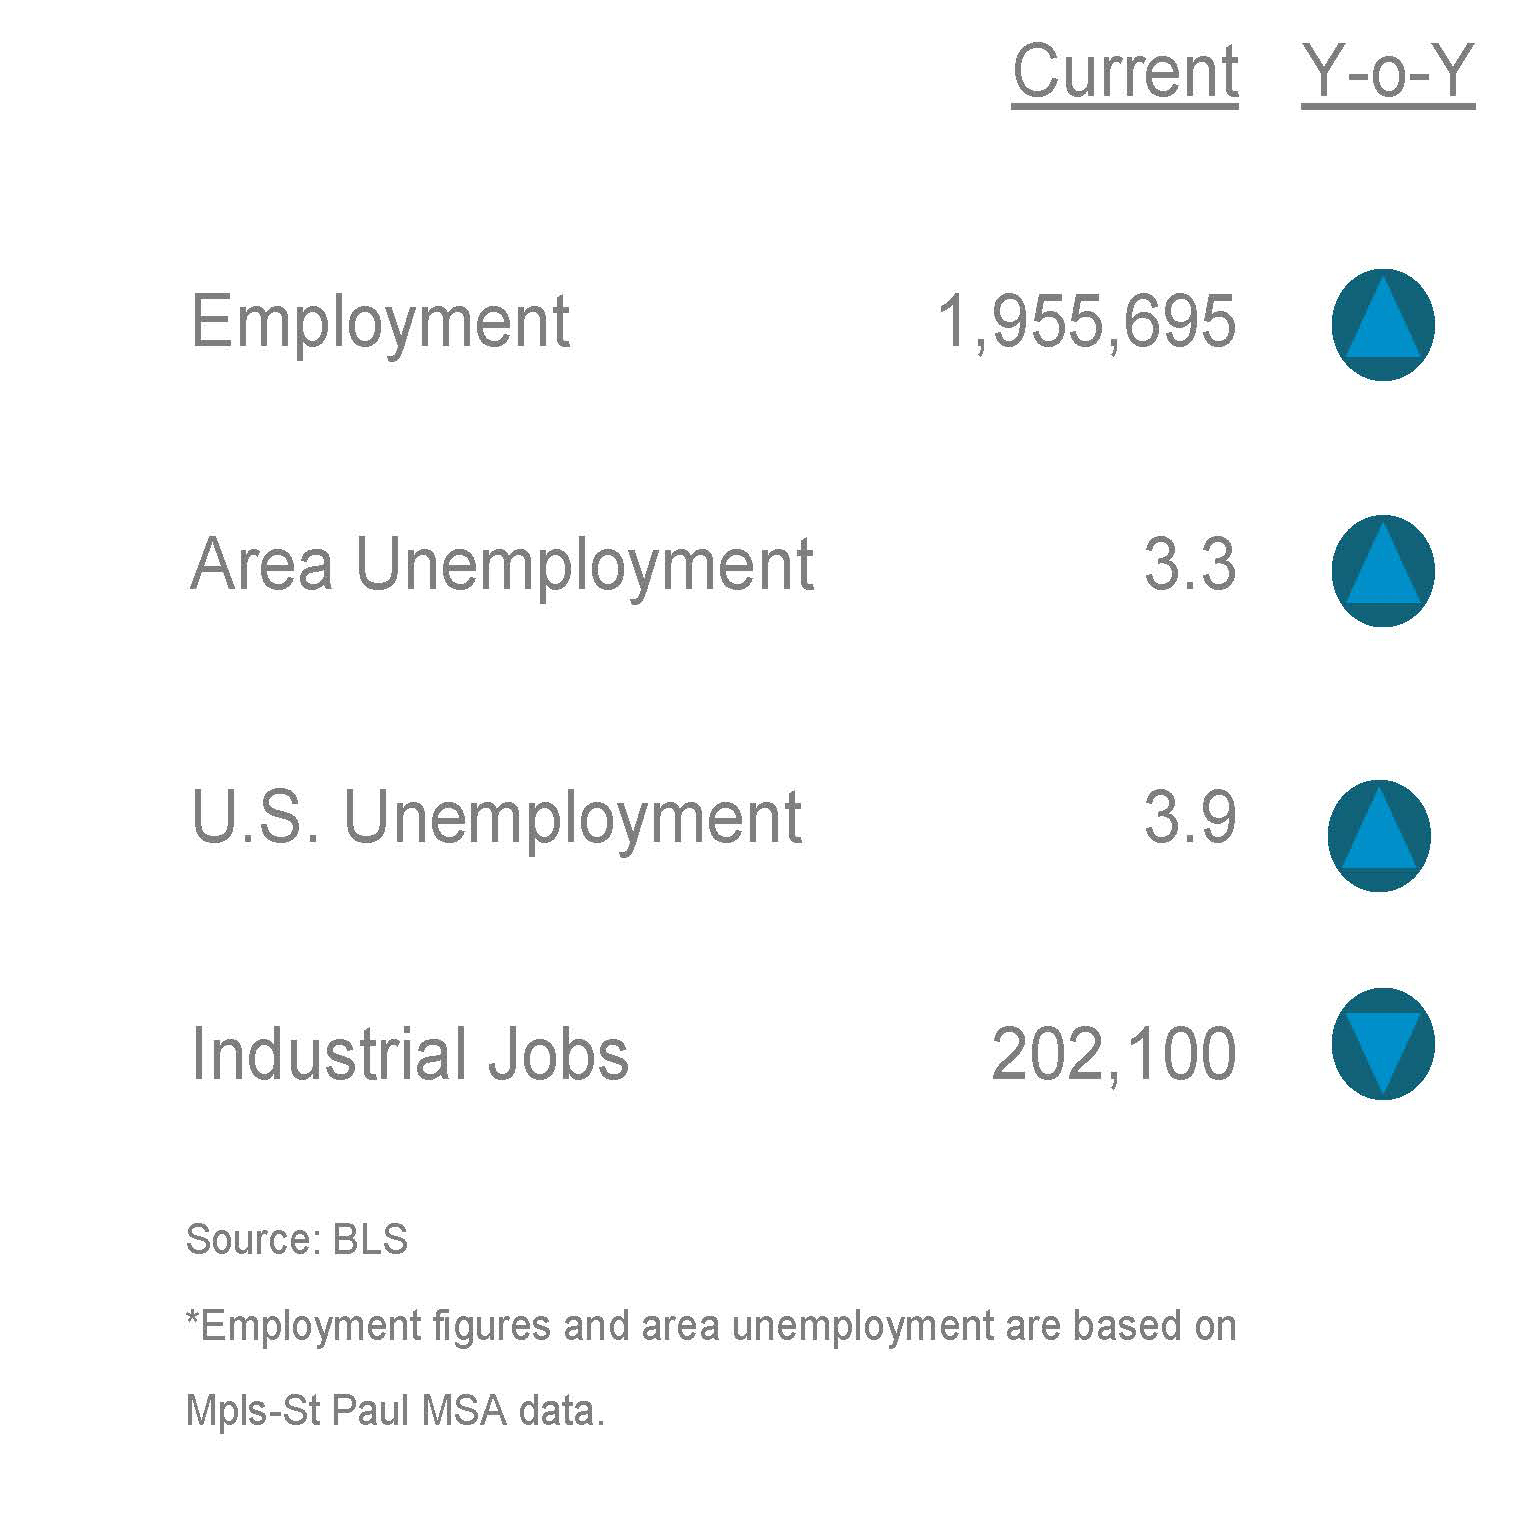
According to the Bureau of Labor Statistics (BLS), the unemployment rate for the Mpls-St Paul metropolitan statistical area (MSA) increased 10 basis points to 3.3% for February 2024 from 3.2% for February 2023. The unemployment rate for the US was at 3.9% in February 2024 increasing 30 basis points from last year. State of Minnesota unemployment rate was 2.7%. The Mpls-St Paul MSA saw an increase in job growth but industrial specific jobs decreased in job growth in manufacturing by 600 during the same period.
MPLS-ST. PAUL AREA EMPLOYMENT STATS:

MARKET OVERVIEW:
The Mpls-St Paul industrial market consists of 293.2 msf in eight counties across the metro. Overall, there was 932,000 sf of positive absorption for Q1 2024, bringing the YTD to 932,000 sf positive absorption. Multi-tenant only properties posted 580,400 sf positive absorption bringing the YTD to 580,400 sf positive absorption. The overall vacancy rate for the quarter was 5.0% and multi-tenant properties vacancy rate was 7.7%. To date, there are 31 construction projects throughout the market totaling 3.5 msf and 20 properties have been delivered this year with 1.6 msf.
MARKET HIGHLIGHTS:
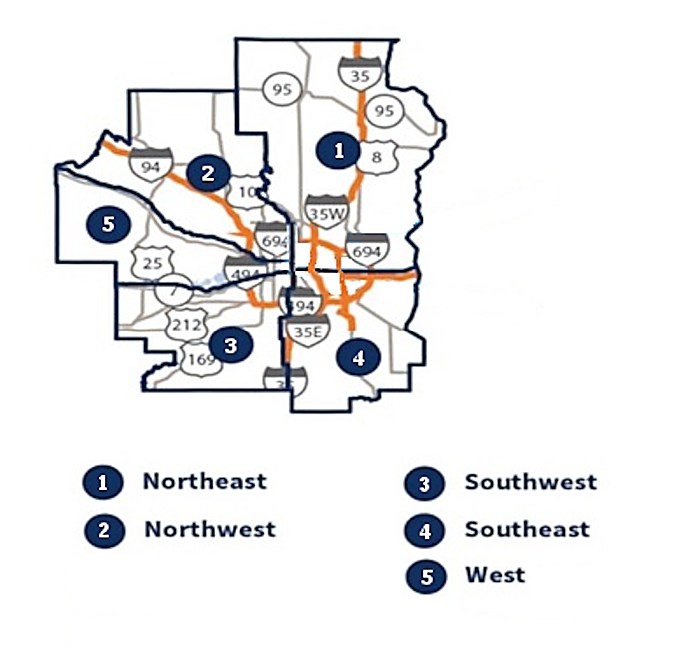
At the close of Q1 2024, the market experienced 1.6 msf of leasing activity in 178 transactions. The Northeast market showed the lowest vacancy rate of 2.8% while the Southeast market is at the top with 6.8% for all properties. The Northwest bested all markets with 420,000 sf positive absorption led by Mas HVAC leasing 203,000 sf. The Northeast market posted the most negative absorption of (72,800) sf led by RJ Schinner vacating 75,000 sf. Seventy one properties sold totaling 2.7 msf for $257.1 million.
MARKET MAP:

Q1 2024 Industrial Market Report is created by Minnesota Commercial Real Estate Association. For more information, you can reach them at: www.mncar.org
Market Insight
Get access to all future Industrial Market Reports below
Industrial Market Experts


News & Updates
Q1 2025 Minneapolis-St. Paul Office Market Summary
MARKET INSIGHTQ1 2025 Minneapolis-St. Paul Office Market SummaryFuture of Twin Cities Office Space: Smaller, Smarter, and Sustainable Forte’s Kate Damato, Senior Associate-Real Estate Advisory, provides insight to the Twin Cities office market report recently...
Q1 2025 Minneapolis-St. Paul Industrial Market Summary
MARKET INSIGHTQ1 2025 Minneapolis-St. Paul Industrial Market SummaryTwin Cities industrial market enters 2025 with sustained momentum in absorption and decreasing vacancy By: Erik Nordstrom, Senior Associate-Real Estate Advisory provides insight to the Twin Cities...
Q4 2024 Minneapolis-St. Paul Industrial Market Summary
MARKET INSIGHTQ4 2024 Minneapolis-St. Paul Industrial Market SummaryTwin Cities Industrial market ends 2024 with strong occupancy but weak warehouse office absorption By: John Young, CCIM, Vice President - Real Estate Advisory The Twin Cities industrial market...


