(952) 854-8290 info@forterep.com

MARKET INSIGHT POST

Q1-2023 Minneapolis-St. Paul Office Market Update

Q4-2022 Minneapolis-St Paul Office Market Report
Forte Vice President, Katie Trevena, Principal, lends insight to the Twin Cities office market report recently released by MNCAR/REDI.   Overall vacancy rates continued to increase in Q1 2023 as large corporate users continued to downsize to reduced footprints and more subleases came to the market.  Most of the sublease availability remains in the CBD but market-wide sublease availability is at a record high.  Subleases typically provide built-out improvements, many are furnished and offered at an aggressive rate.   Landlords will have to compete with these spaces which is why we continue to see spec suites come available.  Class A product saw a slight increase in vacancy but continues to achieve high rental rates to offset high construction costs of adding amenities and a high-quality experience which prospective tenants now require.  Class B & C products will continue to be challenged with declining occupancy and rental rates.   

Q1-2023 Office Market Update

ECONOMIC OVERVIEW:
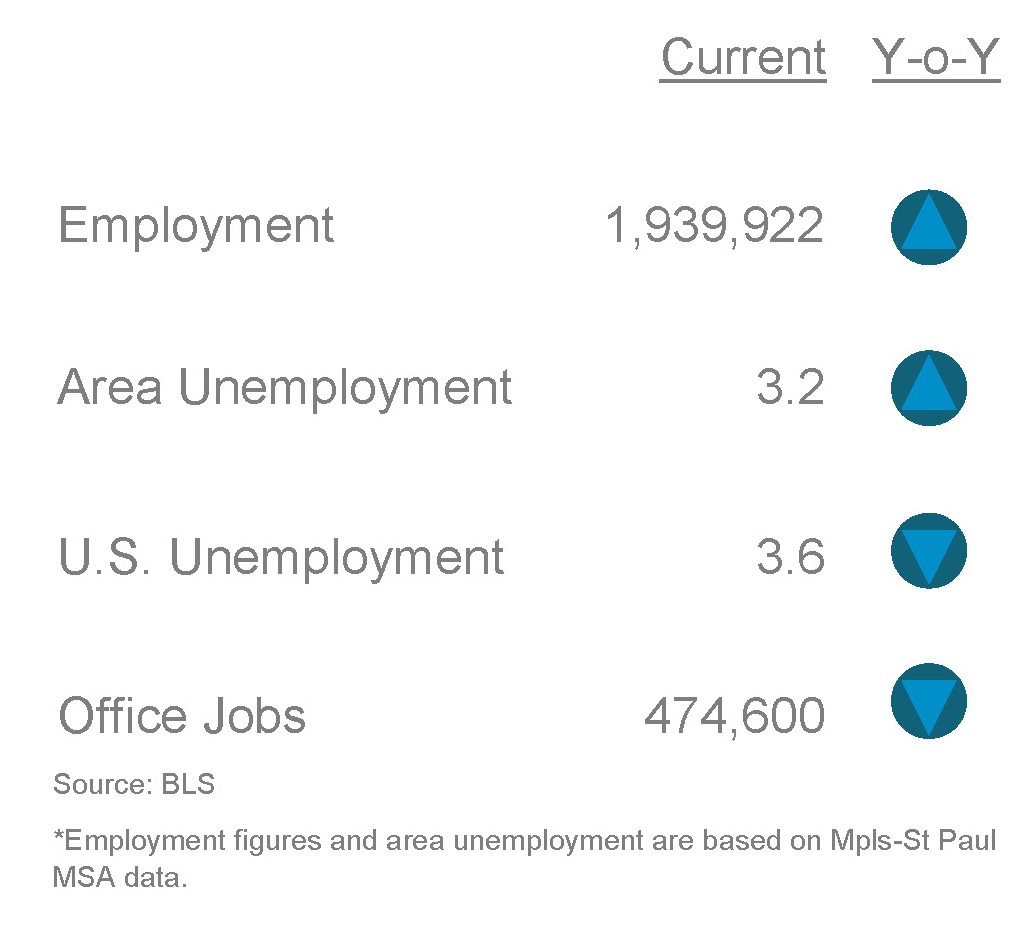
According to the Bureau of Labor Statistics (BLS), the unemployment rate for the Mpls-St Paul metropolitan statistical area (MSA) increased 80 basis points to 3.2% for February 2023 from 2.4% for February 2022. The unemployment rate for the US was at 3.6% in February 2023 down from 3.8% last year. State of Minnesota unemployment rate was 3.0%. The Mpls-St Paul MSA saw a decrease in job growth as well as a decrease in office job growth in professional, financial and information with 6,600 during the same period.
MARKET OVERVIEW:
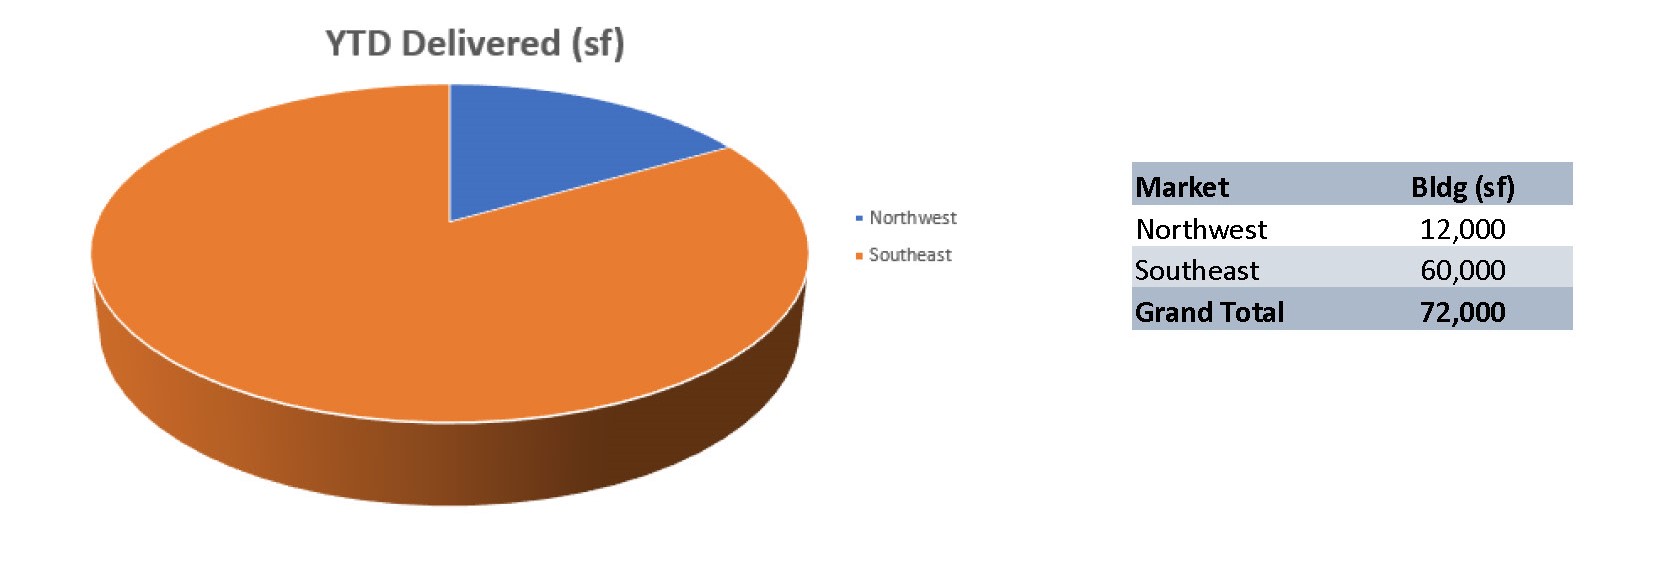
The Mpls-St Paul office market, consisting of 128.6 msf of space in seven metro counties. This region posted (415,000) sf of negative absorption for Q1 2023 and shows an overall vacancy rate of 16.3% for all properties. This quarter showed (369,300) sf of direct negative absorption while subleases accounted for (47,800) sf negative absorption. Multi-tenant only properties posted 21.3% vacancy with (417,000) sf negative absorption. There was (371,000) sf negative absorption for direct space, and (47,800) sf negative absorption for subleases. During Q1 2023 there were 16 construction projects throughout the market totaling 840,000. Three properties have been delivered YTD with 72,000 sf.
MARKET HIGHLIGHTS:
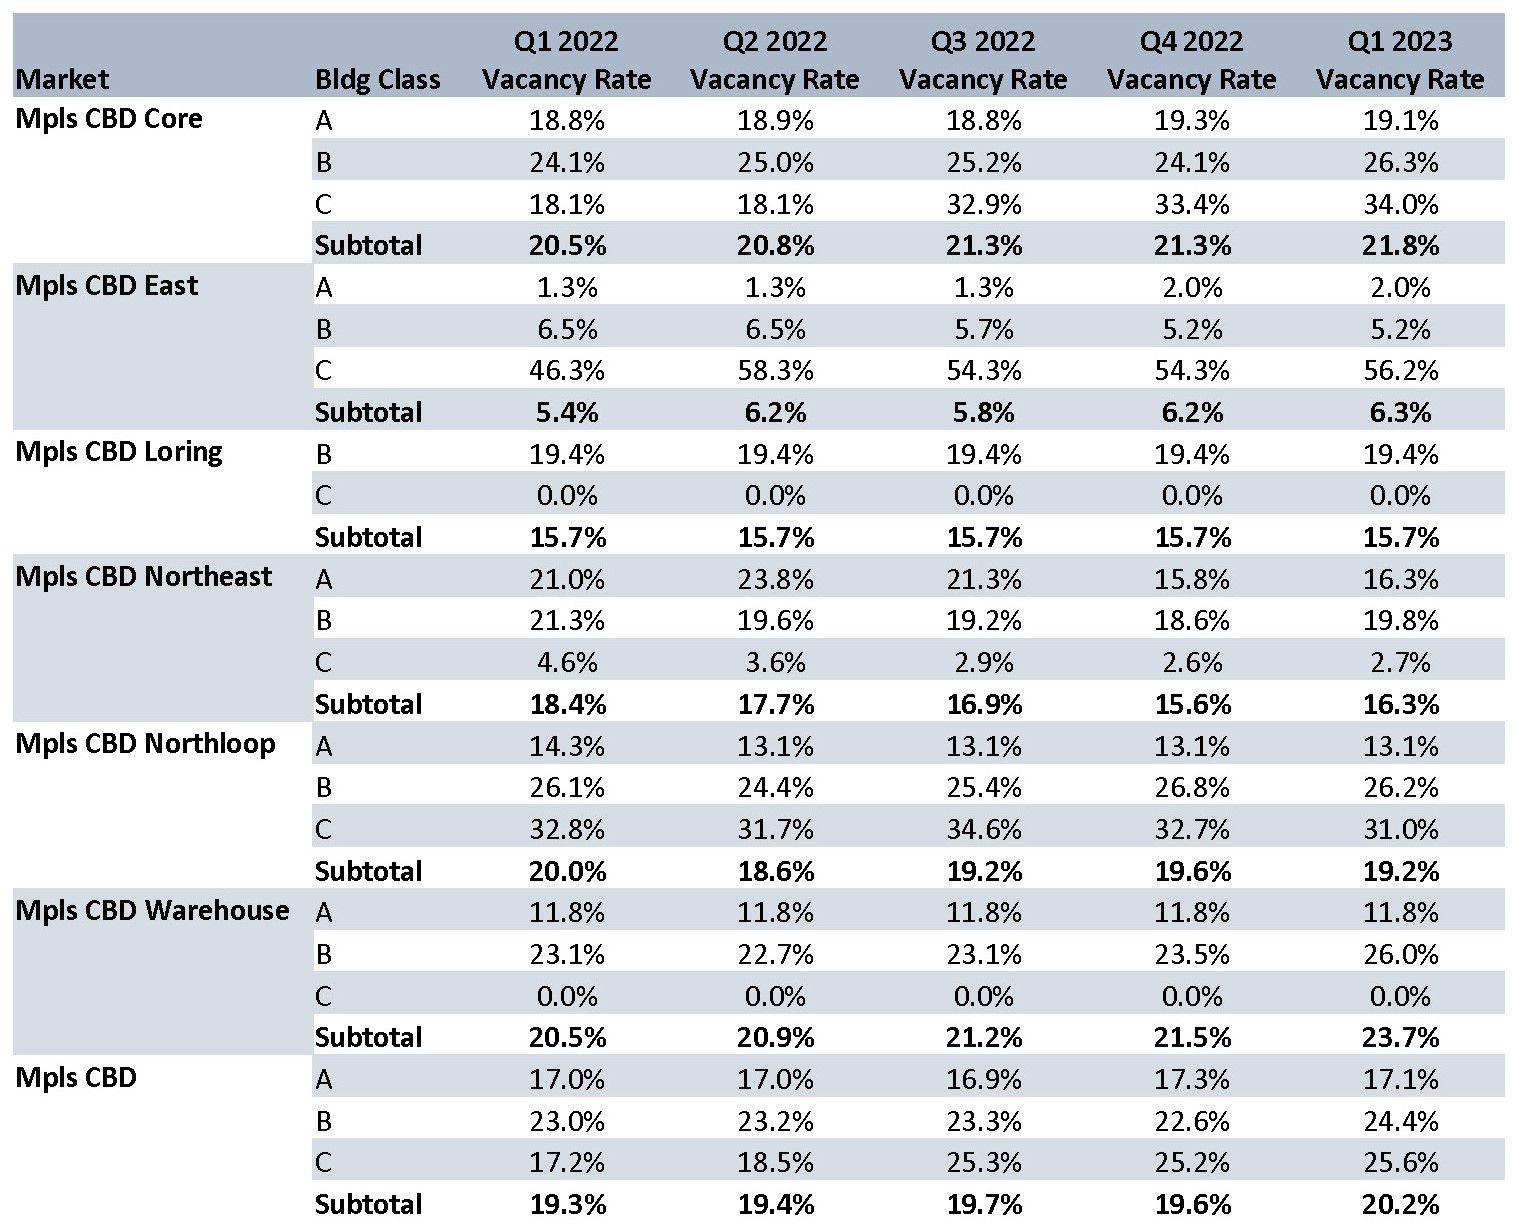
During Q1 2023, the market experienced over 1.275 msf of leasing activity in 335 transactions. Year-over-Year the vacancy rate for multi-tenant direct Class A properties has increased from 15.4% Q1 2022 to 16.9% Q1 2023. For direct leasing Mpls CBD markets posted (191,000) sf negative absorption. The suburban markets posted (116,000) sf negative absorption and St Paul CBD posted (61,000) sf negative absorption.  
MPLS-ST. PAUL AREA EMPLOYMENT STATS:
Q1 2023 Mpls-St Paul Office Employment Stats
MARKET RECAP:
All Properties: Total Inventory: 128,657,855 sf Total # of Buildings: 1,044 Absorption: (415,057) sf Vacancy: 16.3% Asking Rate: $26.54 NNN New Construction: 840,483 sf Multi-Tenant Properties Total Inventory: 89,935,400 sf Total # of Buildings: 846 Absorption: (417,057) Vacancy: 21.3% Asking Rate: $26.55  
MARKET STATS BY BUILDING CLASS

(Multi and Single Tenant)
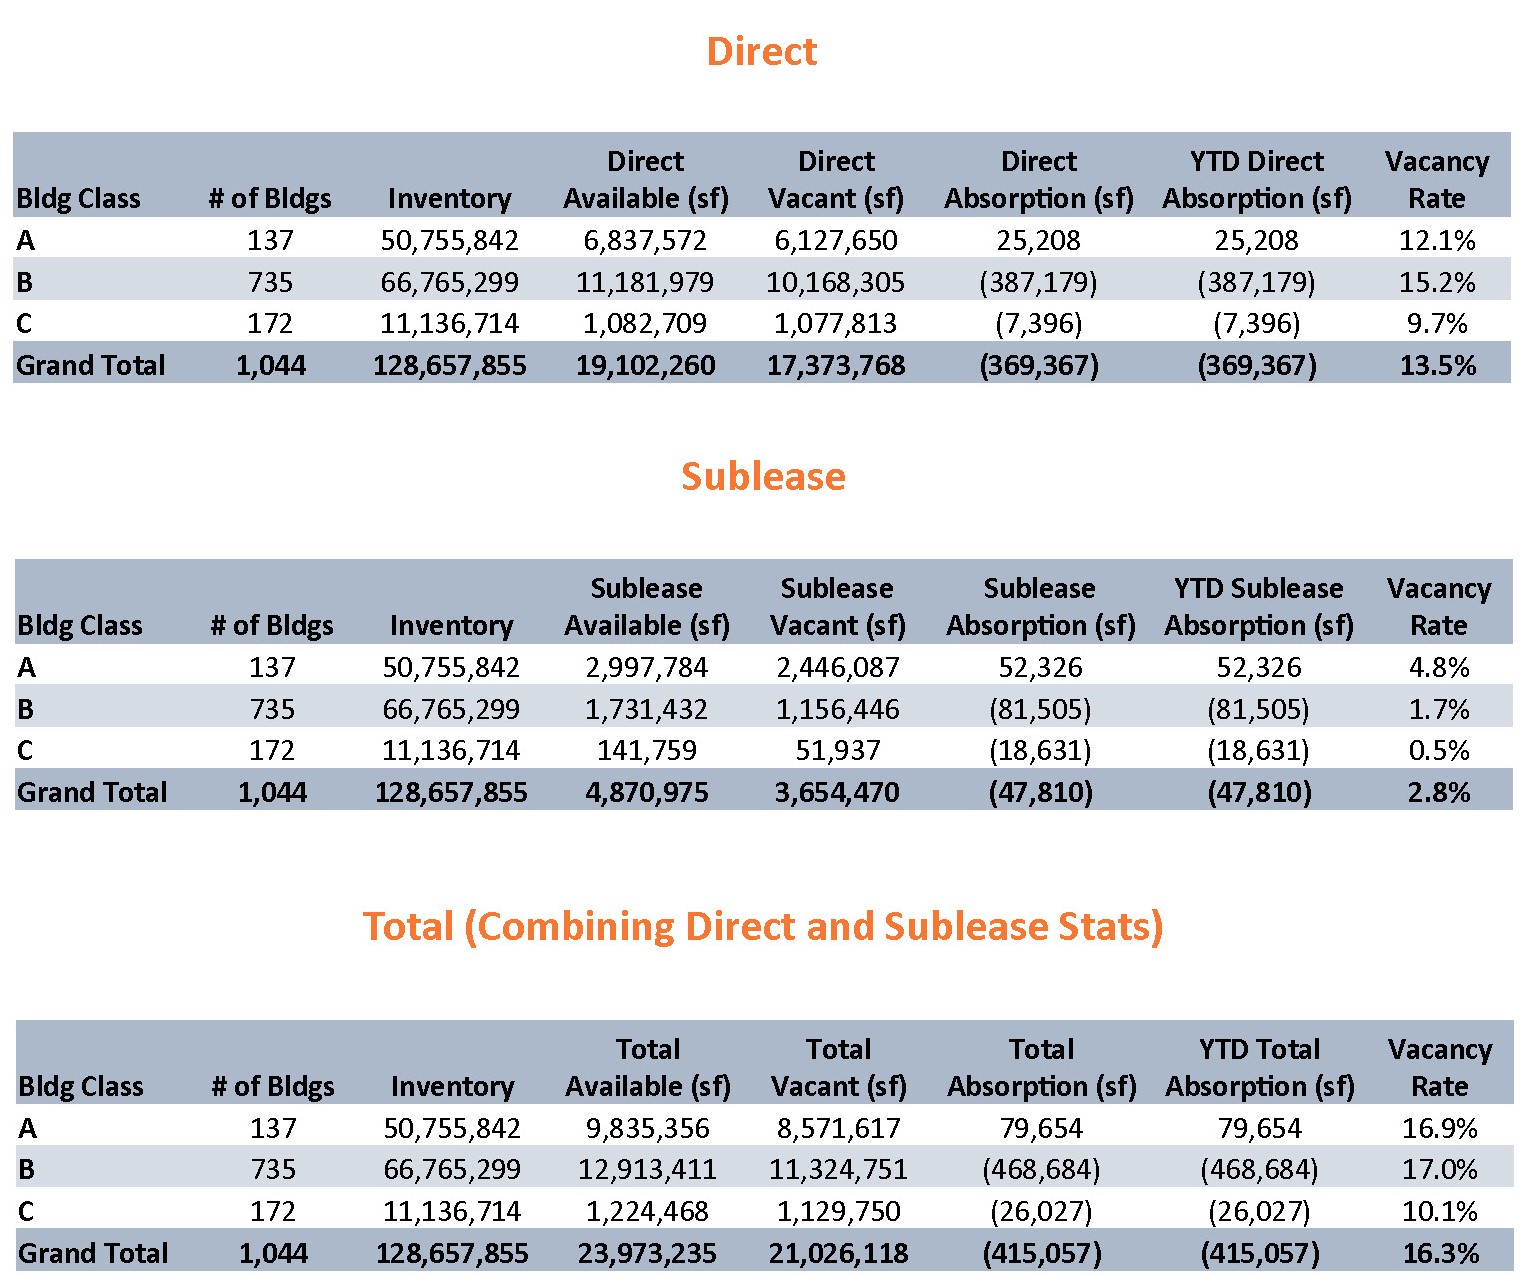
Q1 2023 Mpls-St Paul Office Market Stats by Building Class
ABSORPTION & VACANCY RATE

(Multi and Single Tenant)
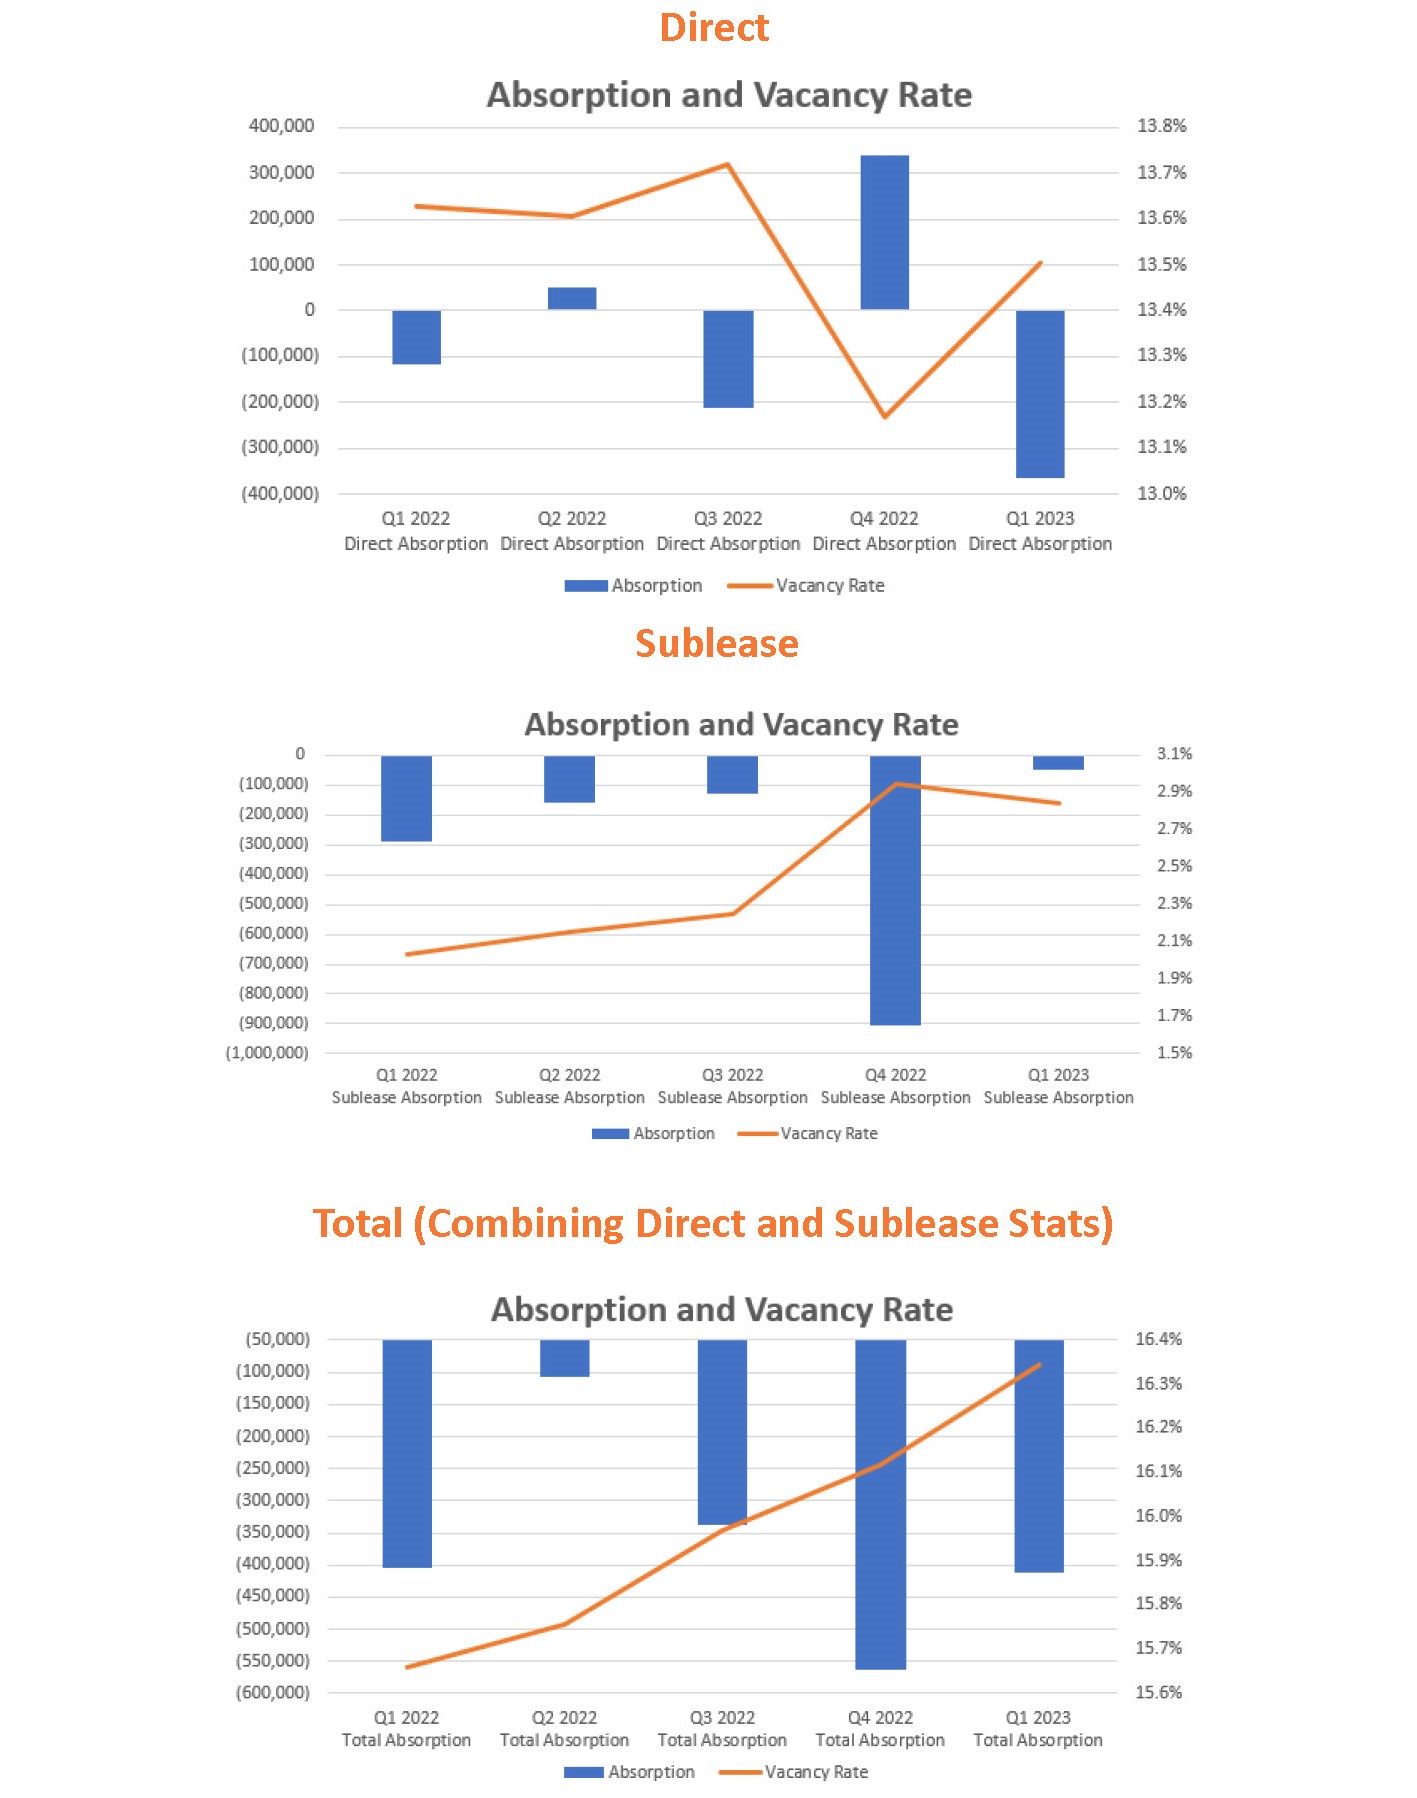
Q1 2023 Mpls-St Paul Office Absorption & Vacancy Rate
MARKET STATISTICS BY MARKET
(Direct Multi and Single Tenant)
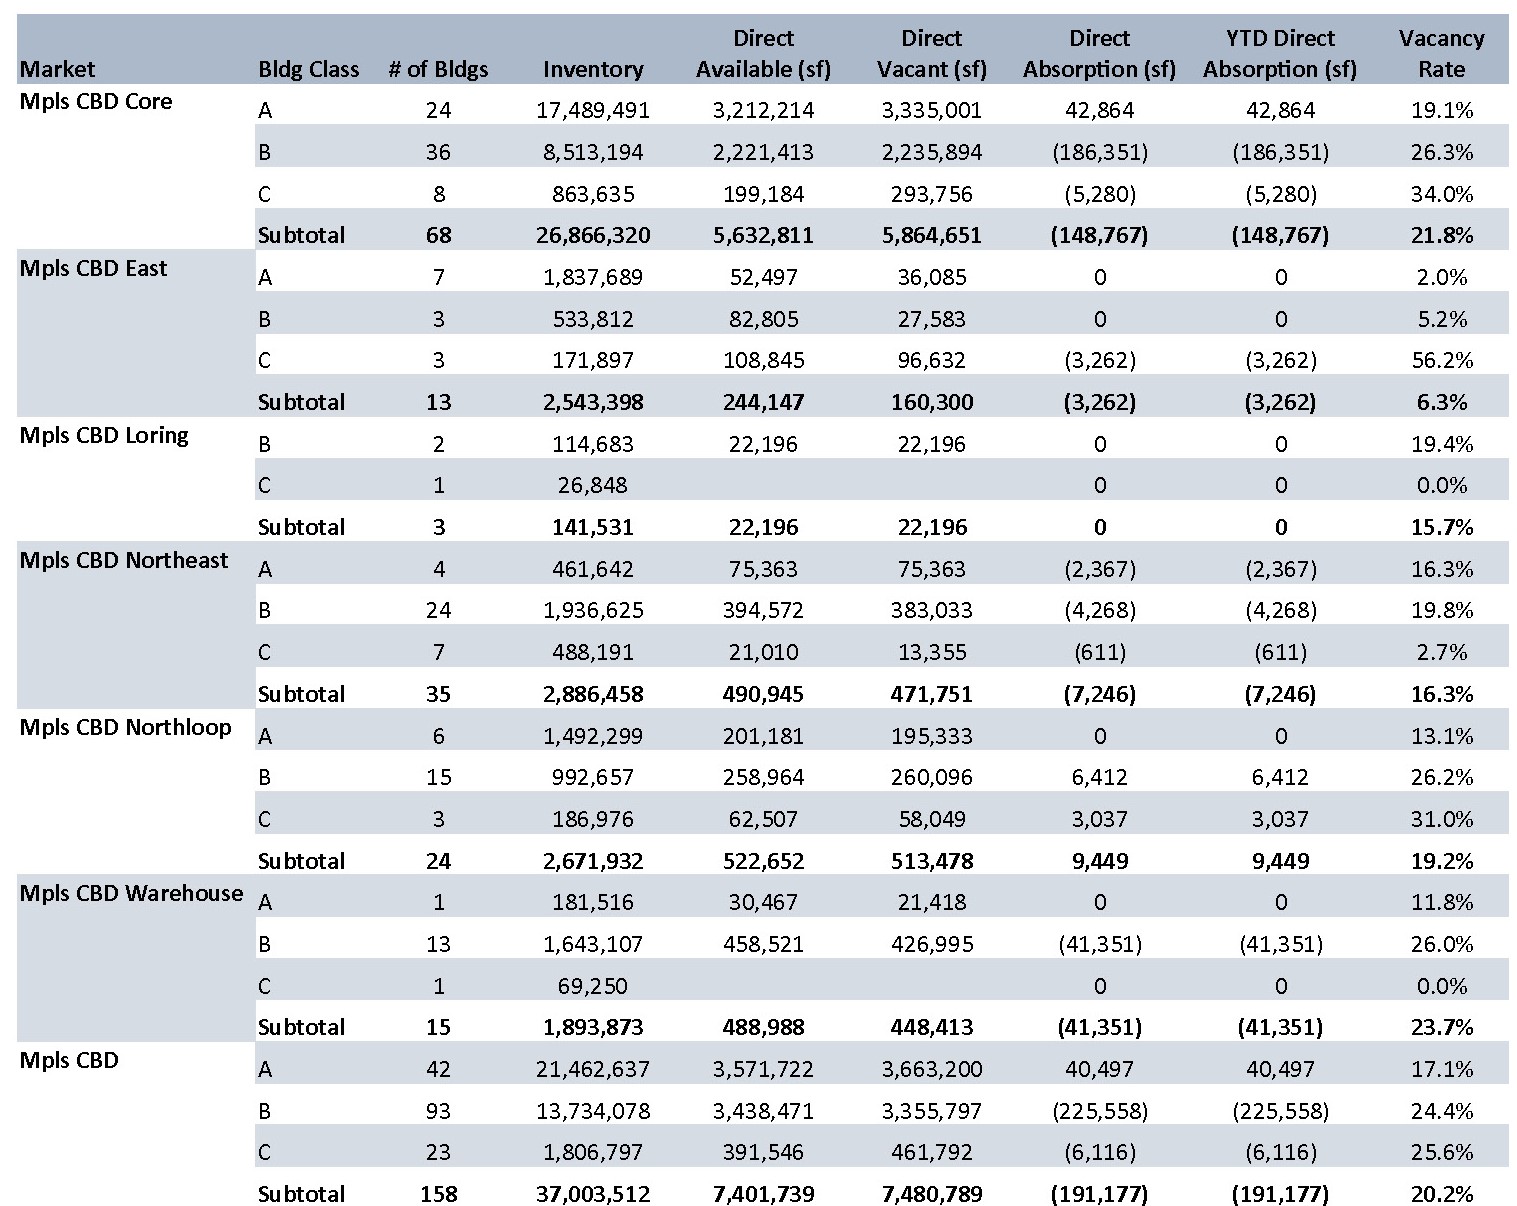
Q1 2023 Mpls-St Paul Office Market Stats by Market
Q1 2023 Mpls-St Paul Office Market Stats by Market Cont.
Q1 2023 Mpls-St Paul Office Market Stats by Market - Graph
VACANCY RATES BY MARKET
(Direct Multi and Single Tenant)
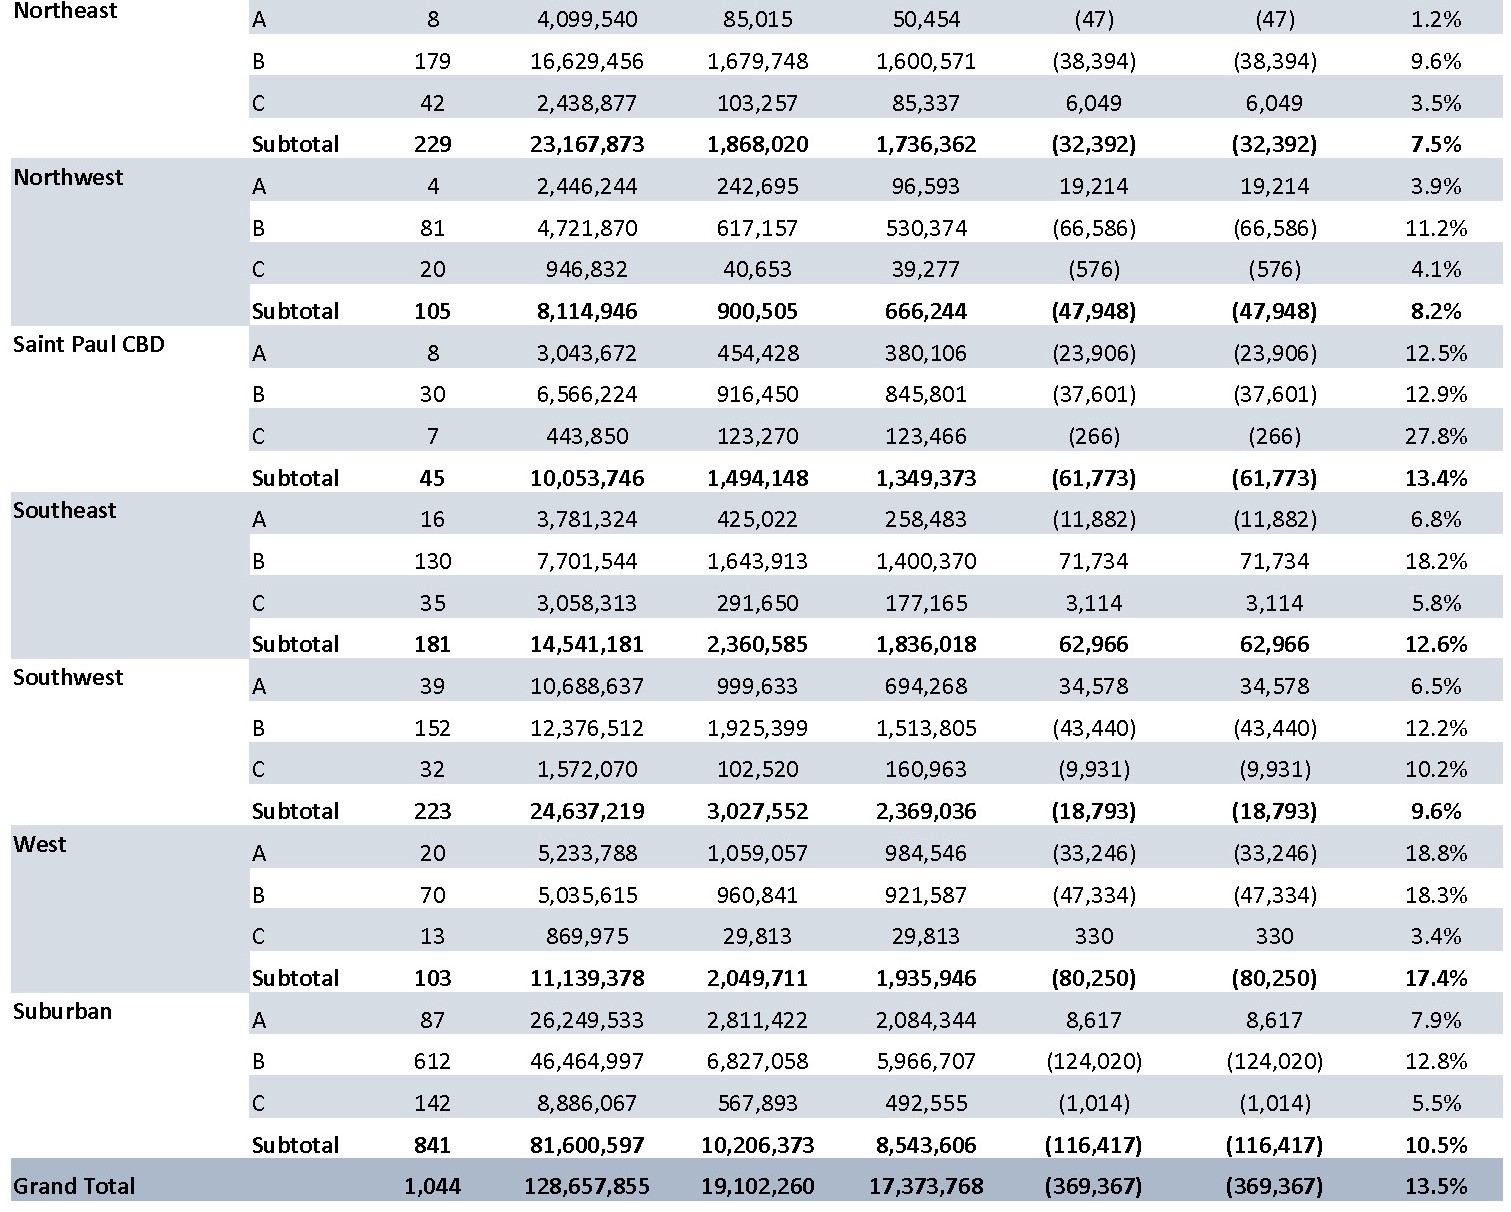
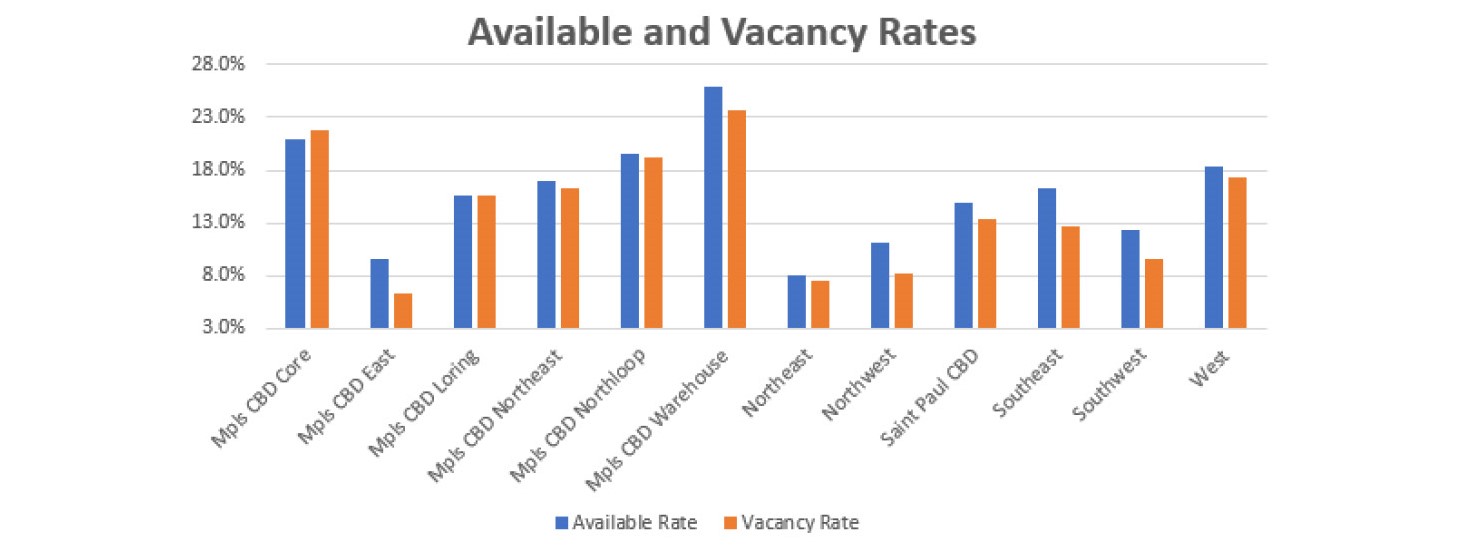
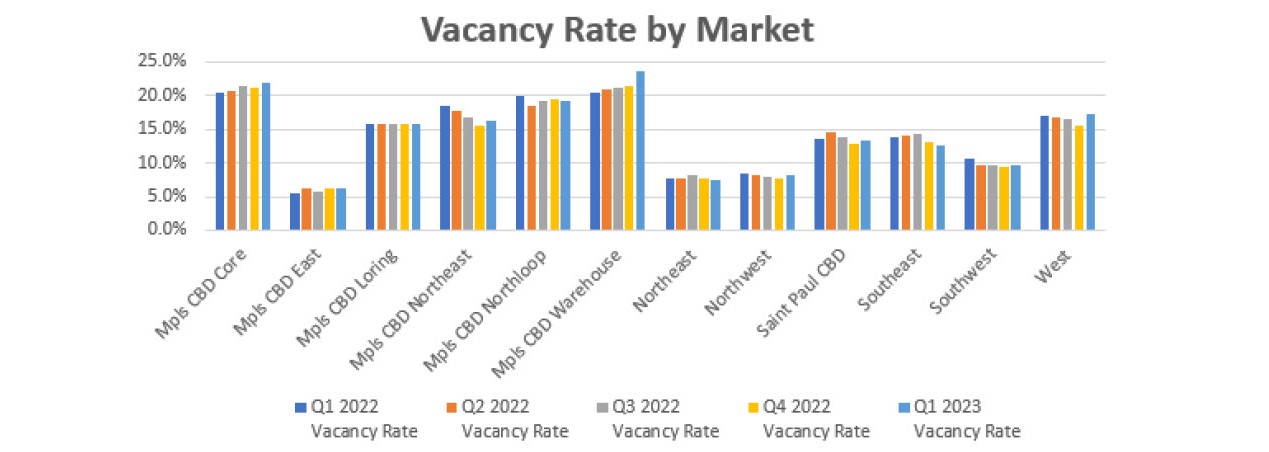
Q1 2023 Mpls-St Paul Office Vacancy Rates by Market
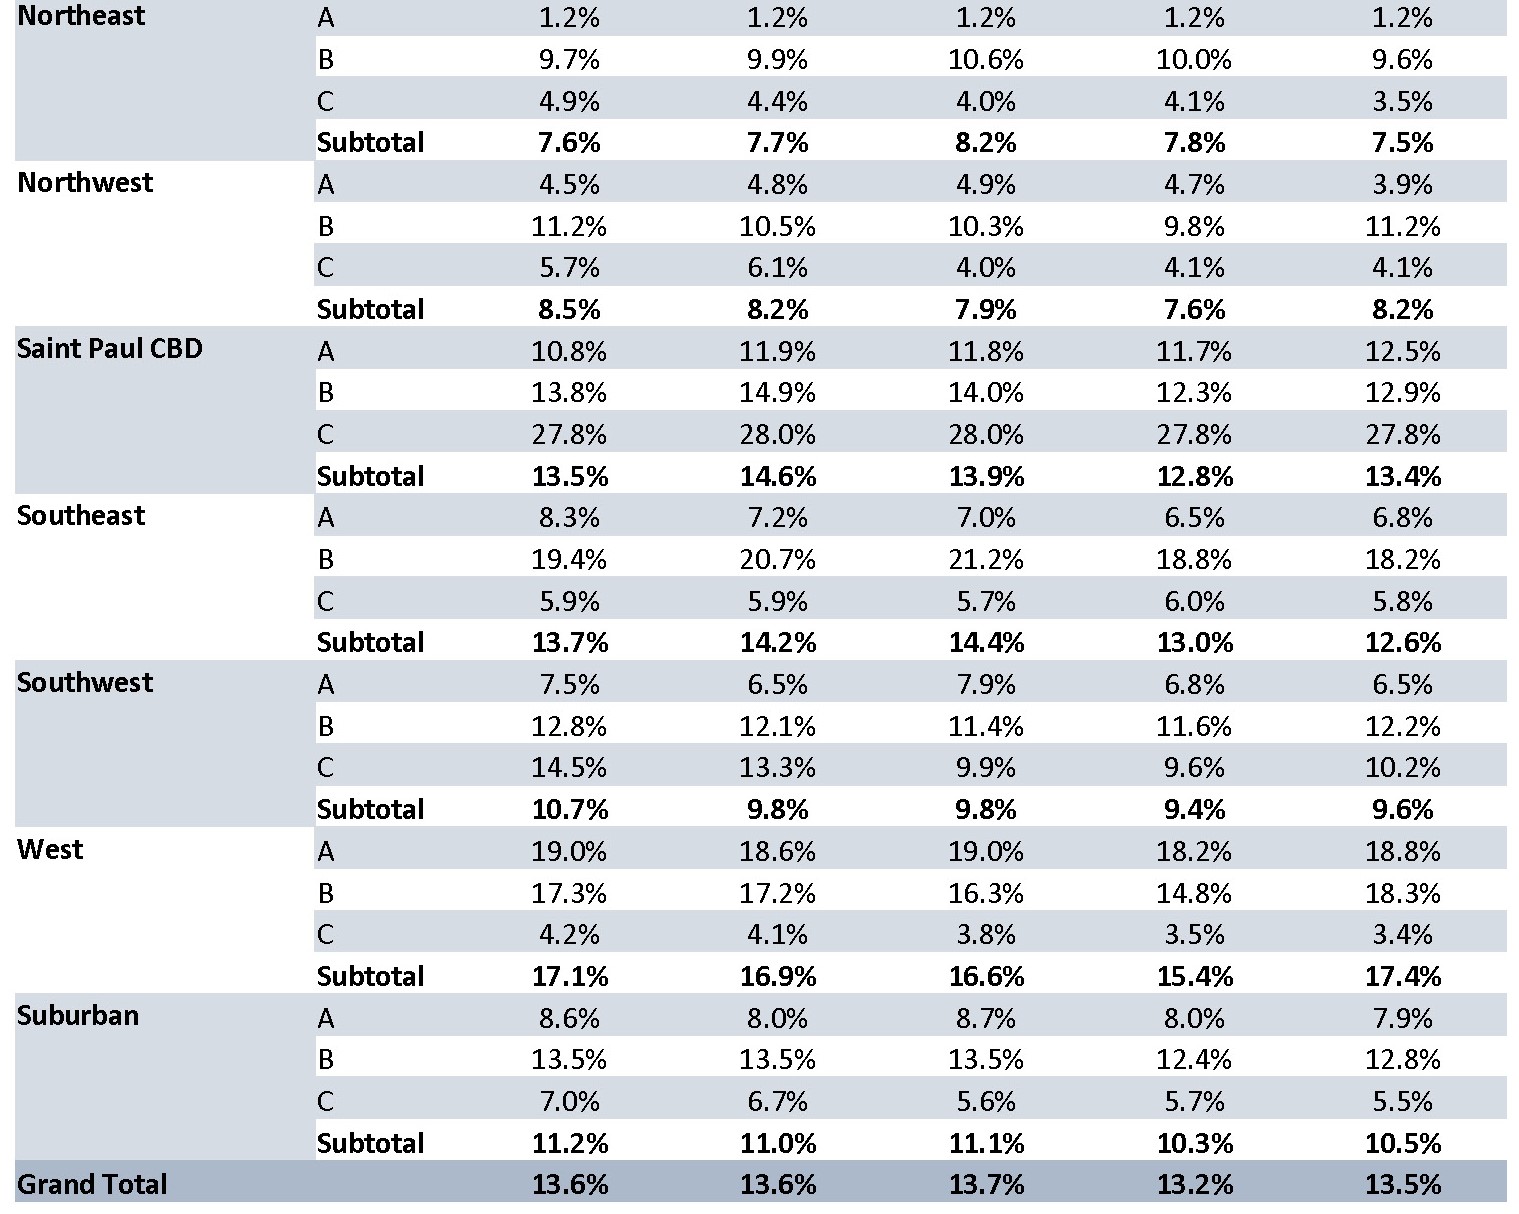
Q1 2023 Mpls-St Paul Office Vacancy Rates by Market Cont.
Q1 2023 Mpls-St Paul Office Vacancy Rates by Market Graph
VACANCY RATES BY BUILDING CLASS
(Multi and Single Tenant)
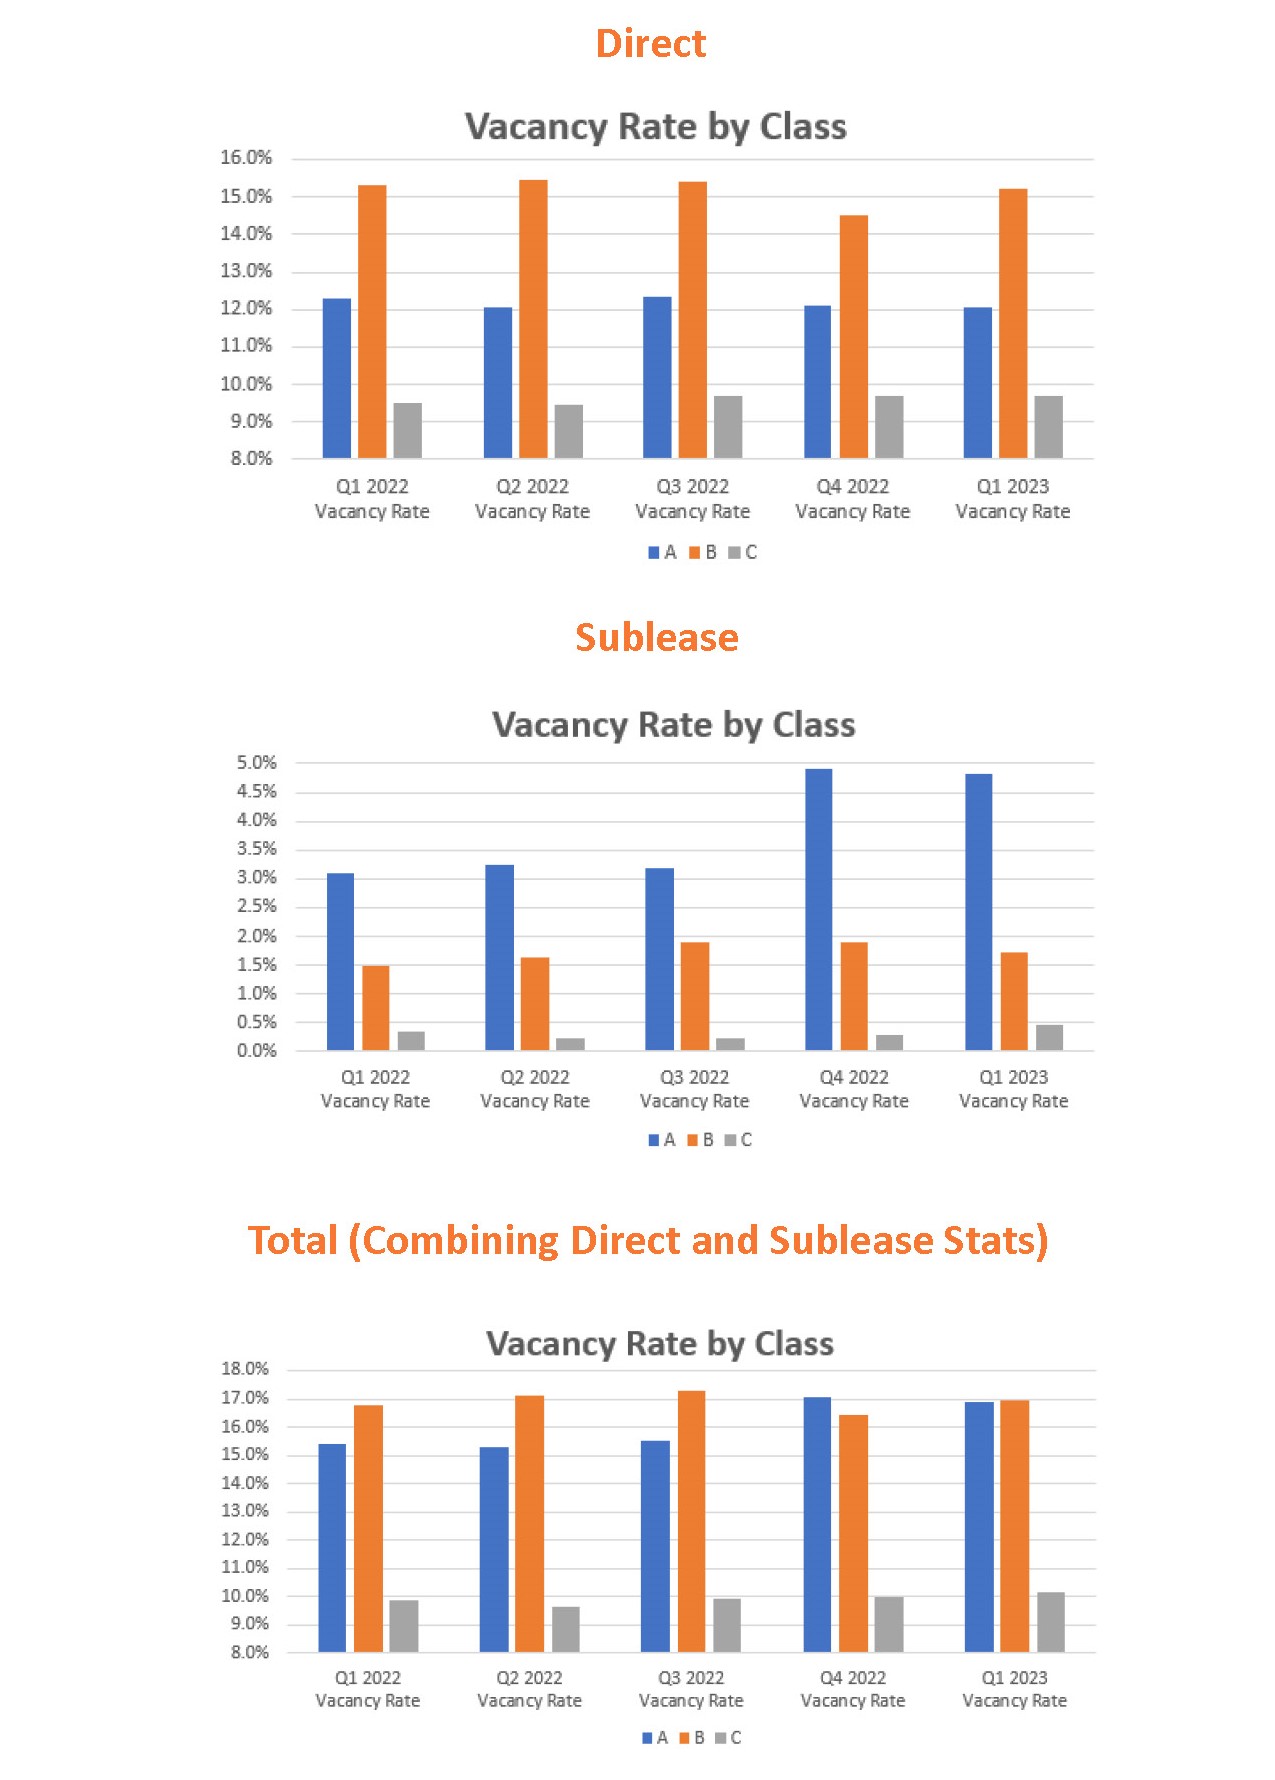
Q1 2023 Mpls-St Paul Office Vacancy Rates by Building Class Graphs
LEASE RATES BY MARKET
(Direct Multi and Single Tenant FSG)
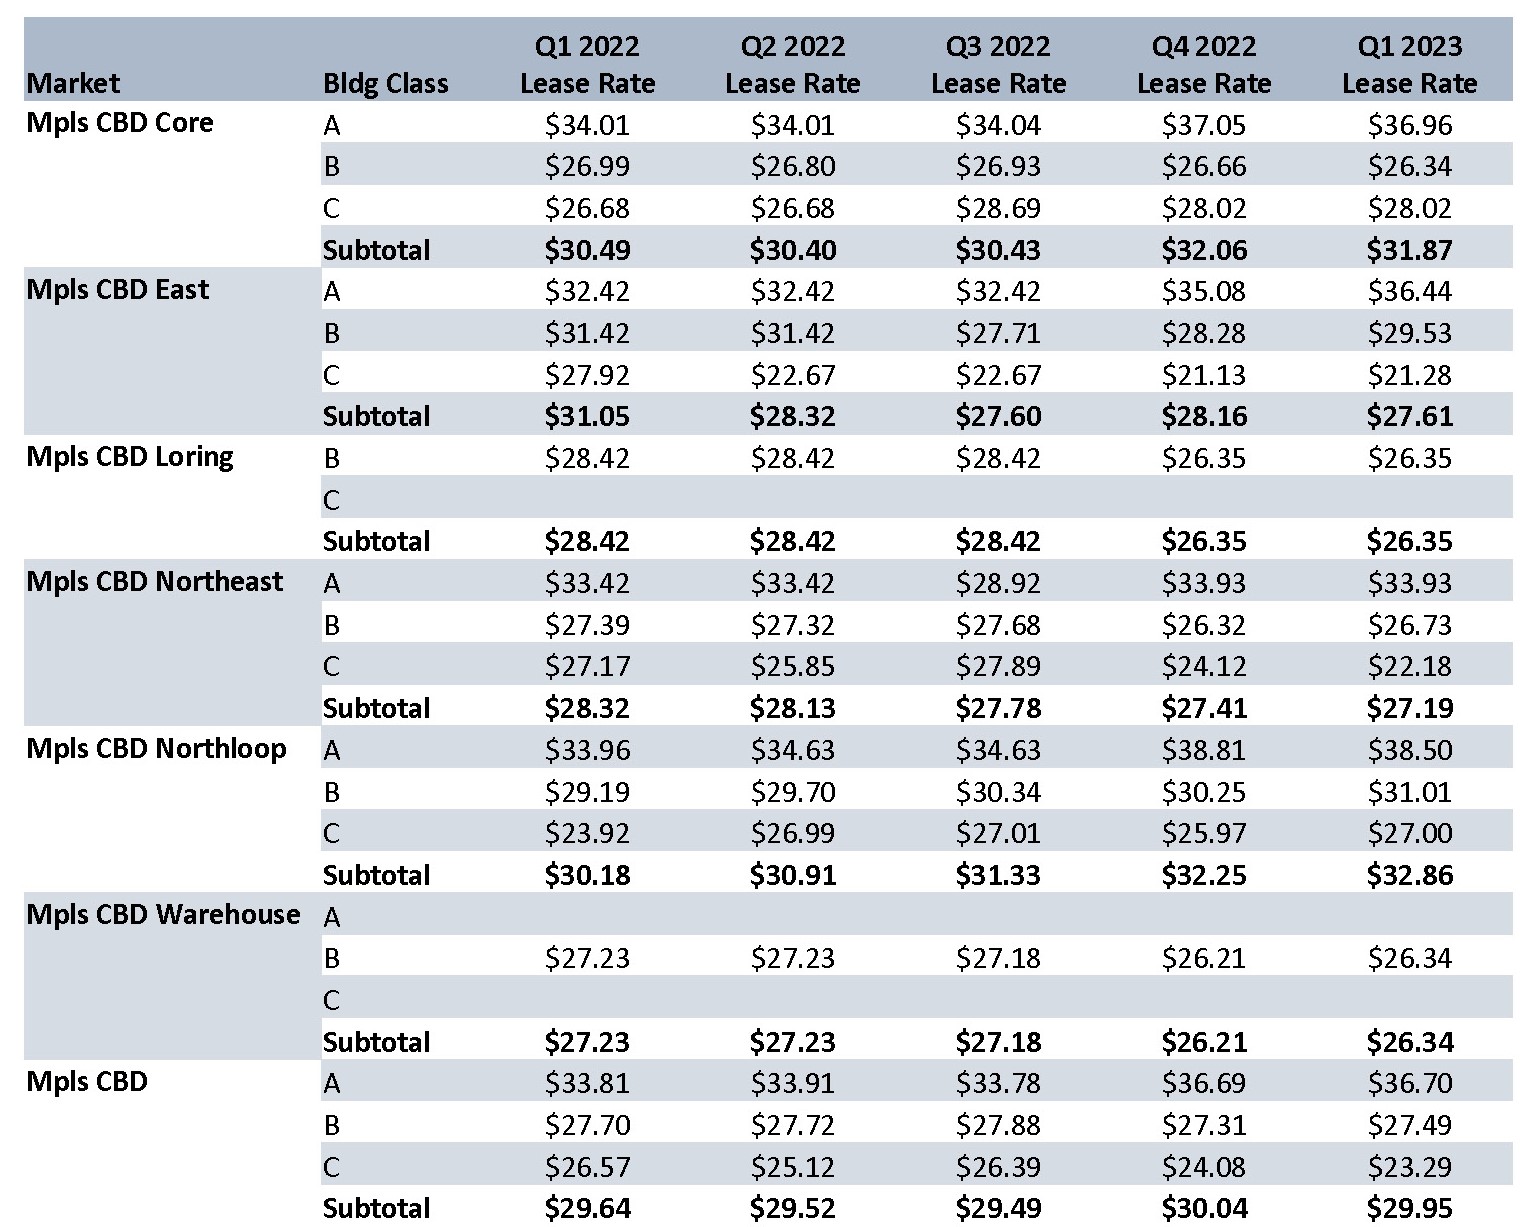
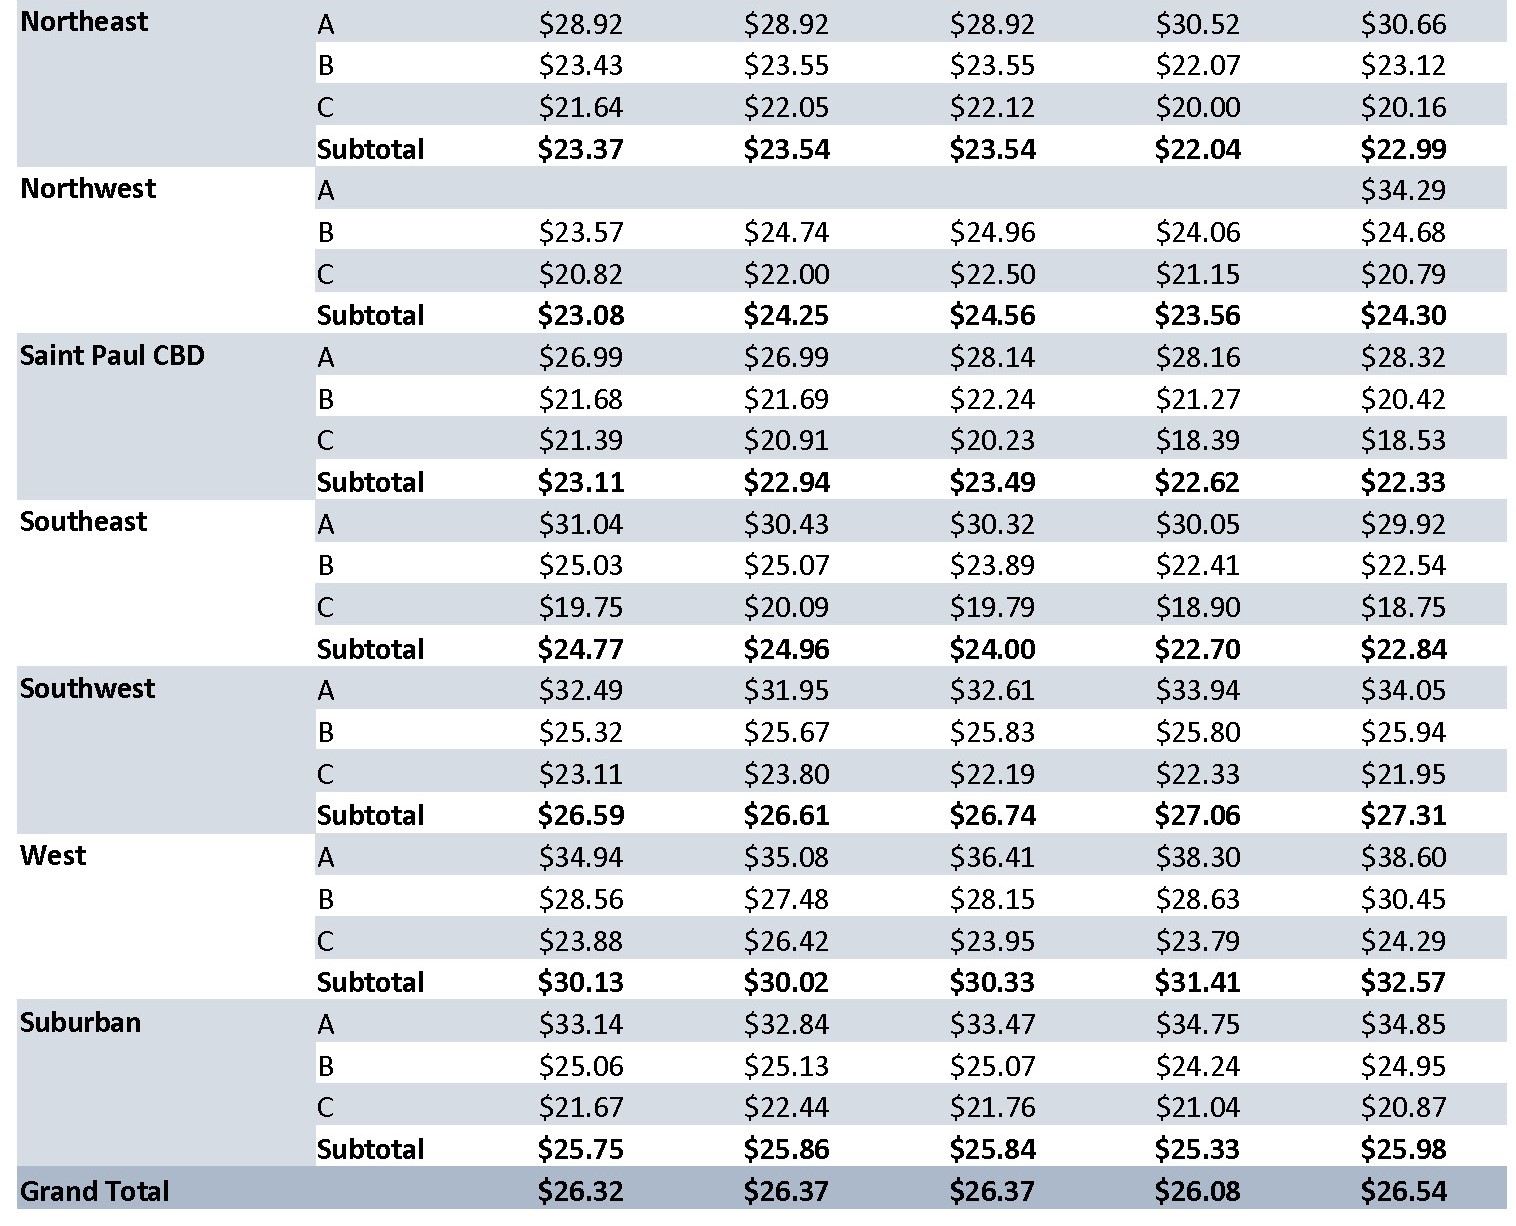
Q1 2023 Mpls-St Paul Office Lease Rates by Market
Q1 2023 Mpls-St Paul Office Lease Rates by Market Cont.
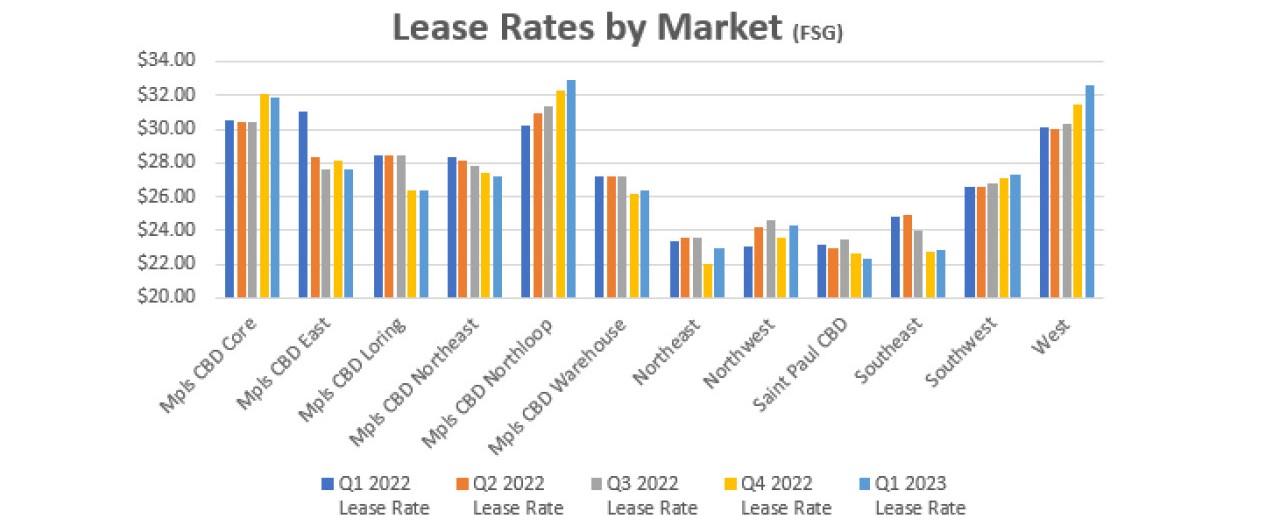
Q1 2023 Mpls-St Paul Office Lease Rates by Market Graph
NEW DEVELOPMENTS
Q1 2023 Mpls-St Paul Office Lease Rates by Market Graph
YEAR-TO-DATE DELIVERIES
Q1 2023 Mpls-St Paul Office Year-to-Date Delivered
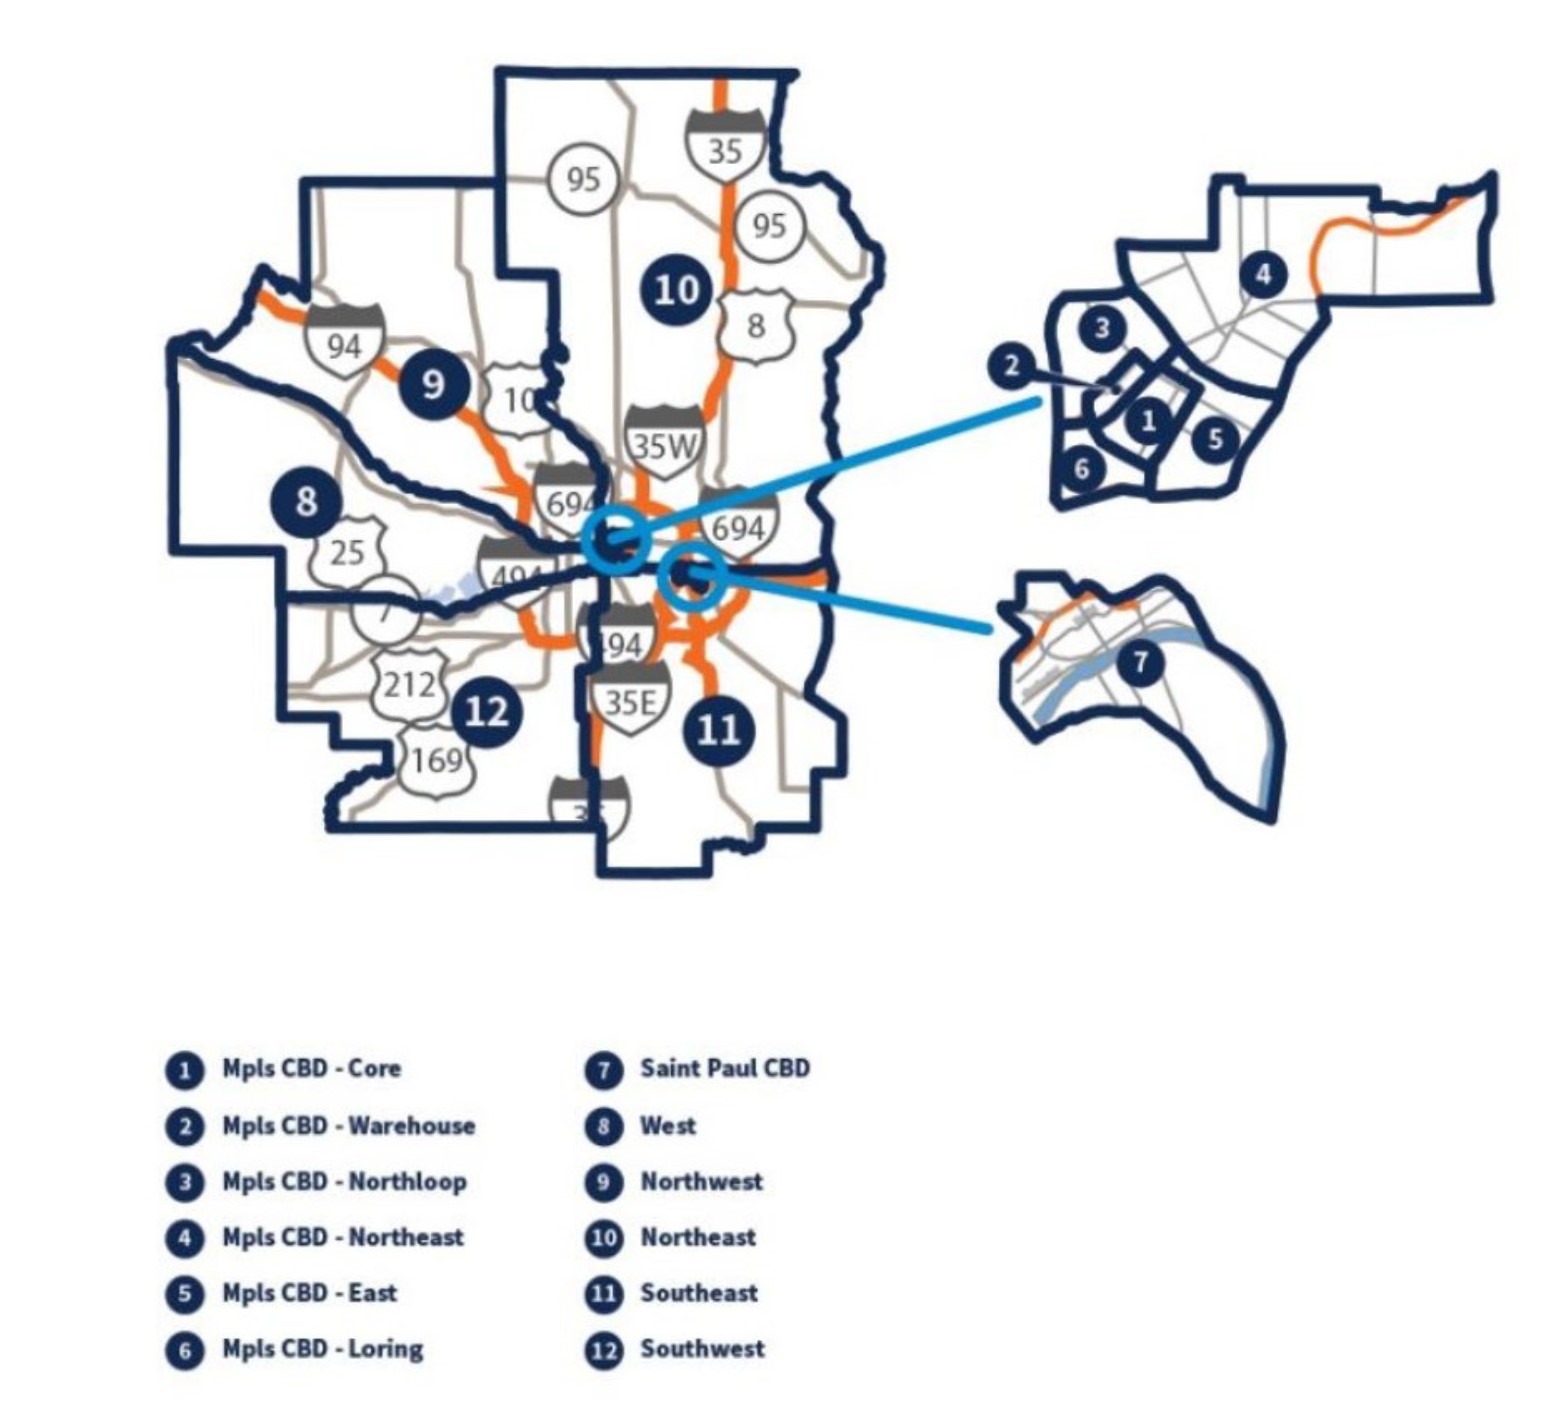
MARKET MAP
Office Market Map

Market Insight

Get access to all future Office Market Reports below

Office Advisory Experts

Jim Jetland, SIOR

Jim Jetland, SIOR

Principal

Nancy Powell

Nancy Powell

Vice President

Katie Trevena

Katie Trevena

Vice President

News

Q2 2024 Minneapolis-St. Paul Industrial Market Summary

Q2 2024 Minneapolis-St. Paul Industrial Market Summary

MARKET INSIGHTQ2 2024 Minneapolis-St. Paul Industrial Market SummaryForte's Vice President - Advisory, John Young, provides insight to the Twin Cities industrial market report recently released by MNCAR/REDI. Vacancy rates for industrial space are on the rise,...

Q2 2024 Minneapolis-St. Paul Office Market Summary

Q2 2024 Minneapolis-St. Paul Office Market Summary

MARKET INSIGHTQ2 2024 Minneapolis-St. Paul Office Market SummaryForte's Ericka Miller, Vice President Real Estate Advisory, provides insight to the Twin Cities office market report recently released by MNCAR/REDI. Low unemployment rates can often align with a strong...

Q1 2024 Minneapolis-St Paul Office Market Summary

Q1 2024 Minneapolis-St Paul Office Market Summary

MARKET INSIGHTQ1 2024 Minneapolis-St. Paul Office Market SummaryForte Principal, Jim Jetland, provides insight to the Twin Cities office market report recently released by MNCAR/REDI. While there are a few bright spots with the Twin Cities Office Market the general...

Loading...