(952) 854-8290 info@forterep.com

MARKET INSIGHT POST

Q4-2022 Minneapolis-St. Paul Industrial Market Update
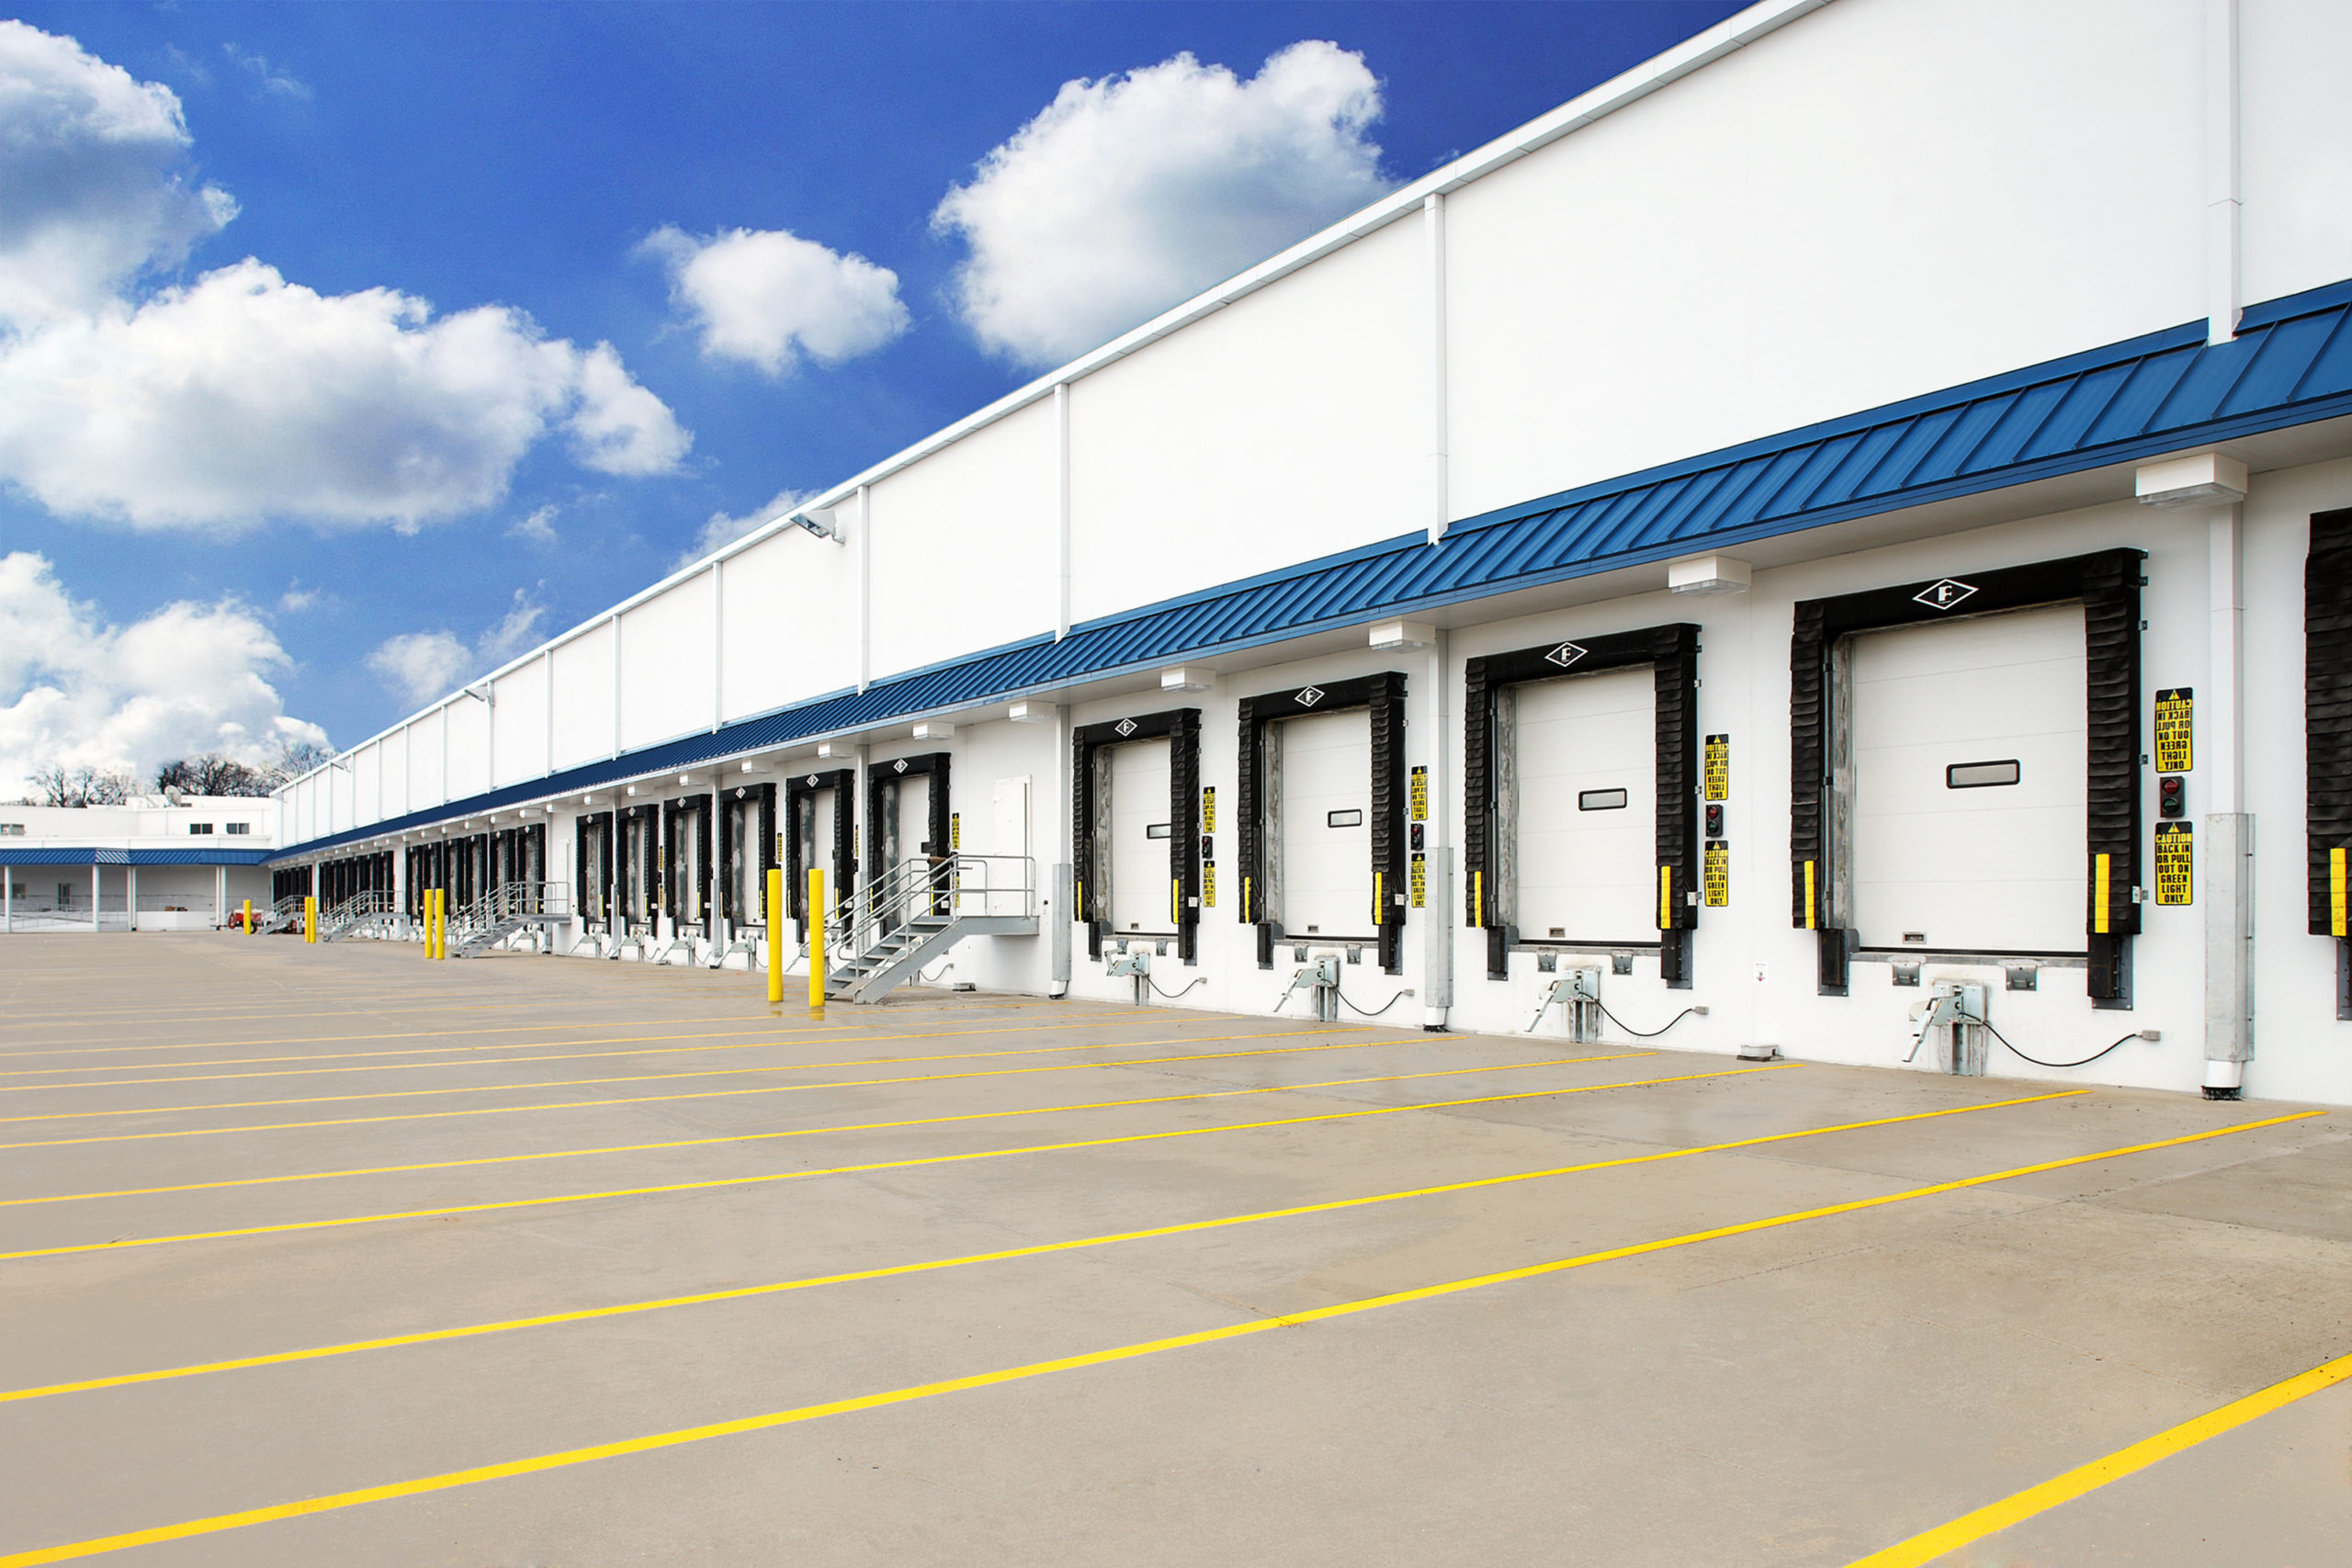
Q4 2022 Industrial Market Update Building Image
Forte Principal, Phil Simonet, provides insight to the Twin Cities industrial market report recently released by MNCAR/REDI.   The Twin Cities industrial market remains consistently strong with year-end numbers for 2022 very similar to the previous record-breaking numbers from 2021.  Net absorption of space totaled just over 6 million square feet which was slightly below 2021 total net absorption of 6.39 million square feet.  The overall industrial vacancy rate decreases by one tenth of a percent (0.1%) indicating a remarkable healthy and stable market.  New construction remains exceptionally strong with 7.88 million square feet under construction and 6.016 million square feet delivered in 2022. The market is characterized by low vacancy rates in all three product types (bulk/distribution, office warehouse and office showroom) record breaking net rates per square foot and annual net rent escalations of 4-5%.  The high cost of tenant improvements continues to challenge both owners and tenants looking to make a deal and combined with supply chain issues and other material related shortages, have significantly increased the timeframe required to locate new space, negotiate lease terms, and complete a build-out.   The best advice today is start EARLY! While all is well in the industrial markets, potential headwinds are forming that may reduce the strong performance of the past several years.  Higher interest rates will impact new speculative construction costs, continued labor shortages are impacting companies’ ability to expand and economic indicators point toward a slowing of the US economy as inflation remain above 6%.

Q4-2022 Minneapolis-St. Paul Industrial Market Update

MARKET RECAP:
All Properties: Total Inventory: 275,202,187 sf Total # of Buildings: 3,186 Absorption: 1,210,144 sf Vacancy: 3.5% Asking Rate Low: $7.36 NNN Asking Rate High: $10.86 NNN Under Construction: 7,885,799 sf Multi-Tenant Properties Total Inventory: 145,013,628 sf Total # of Buildings: 1,792 Absorption: 1,095,707 Vacancy: 5.1% Asking Rate Low: $7.38 Asking Rate High: $10.99
ECONOMIC OVERVIEW:
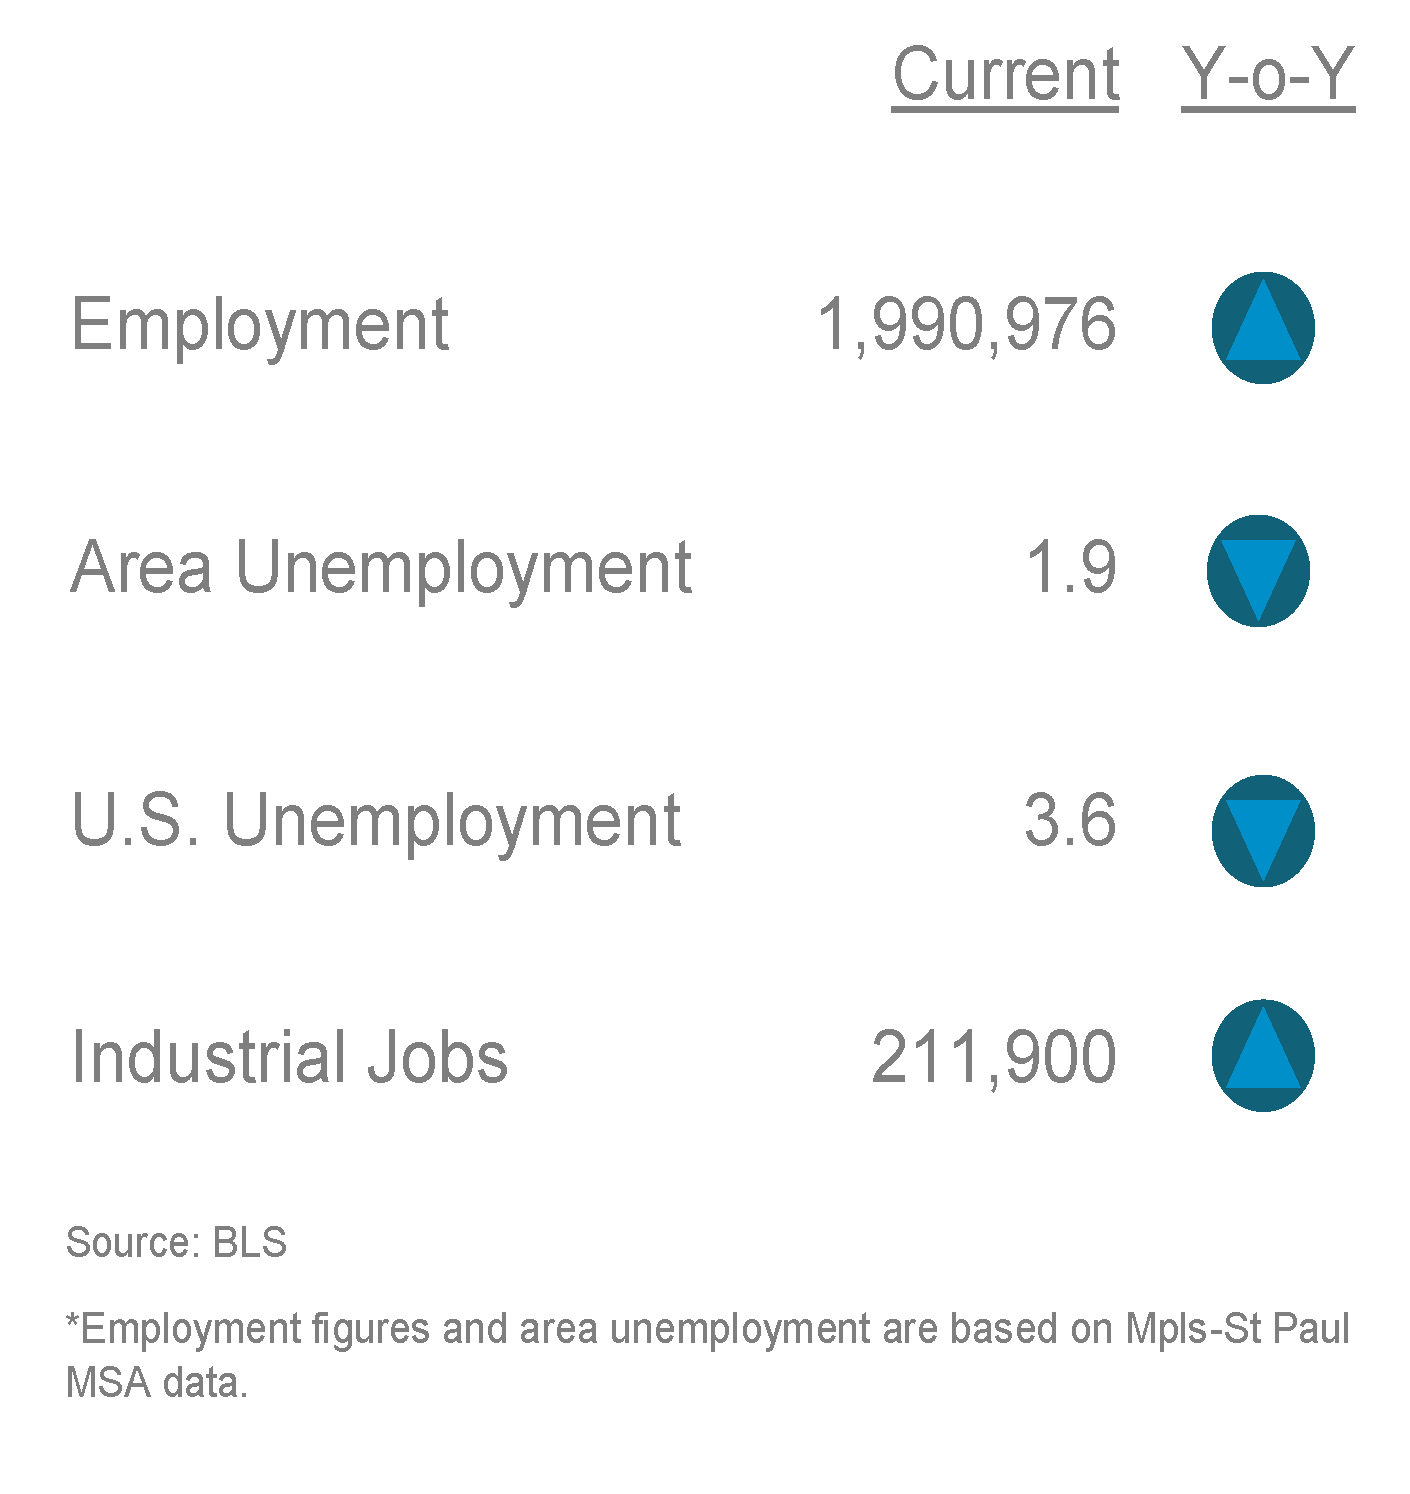
According to the Bureau of Labor Statistics (BLS), the unemployment rate for the Mpls-St Paul metropolitan statistical area (MSA) decreased 30 basis points to 1.9% for November 2022 from 2.2% for November 2021. The unemployment rate for the US was at 3.6% in November 2022 down from 4.2% last year. State of Minnesota unemployment rate was 2.3%. The Mpls-St Paul MSA saw an increase in job growth as well as an increase in industrial job growth specifically in manufacturing with 13,300 during the same period.

MPLS-ST. PAUL AREA EMPLOYMENT STATS:

Mpls-St. Paul Area Employment Stats - Industrial
MARKET OVERVIEW:
The Mpls-St Paul industrial market consists of 275 msf in eight counties across the metro. There was just over 1.2 msf of positive absorption overall for Q4 2022 increasing YTD to over 6.0 msf. Multi-tenant only properties posted 1.0 msf positive absorption bringing the YTD to 4.0 msf. The overall vacancy rate for the market was 3.5% and multi -tenant vacancy was 5.1% for Q4 2022. To date, there are 42 construction projects throughout the market totaling 7.8 msf and 48 properties have been delivered YTD with 6.0 msf.
MARKET HIGHLIGHTS:
At the close of Q4 2022, the market experienced over 2.4 msf of leasing activity in 145 transactions. The Northeast market shows the lowest vacancy rate of 2.0% while the West market is at the top with 5.5% for all properties. The Northeast market also topped all markets with 840,000 sf positive absorption led by Colder Products leasing 166,000 sf. The Southwest market posted the highest drop with (86,000) sf negative absorption led by Anagram International vacating 122,000 sf in a sublease. The single largest direct vacancy was Ultralox vacating 93,000 sf in the Southeast market. One hundred thirty two properties sold totaling 8.0 msf for $706 million. 
MARKET STATISTICS BY PROPERTY TYPE
Multi and Single Tenant:
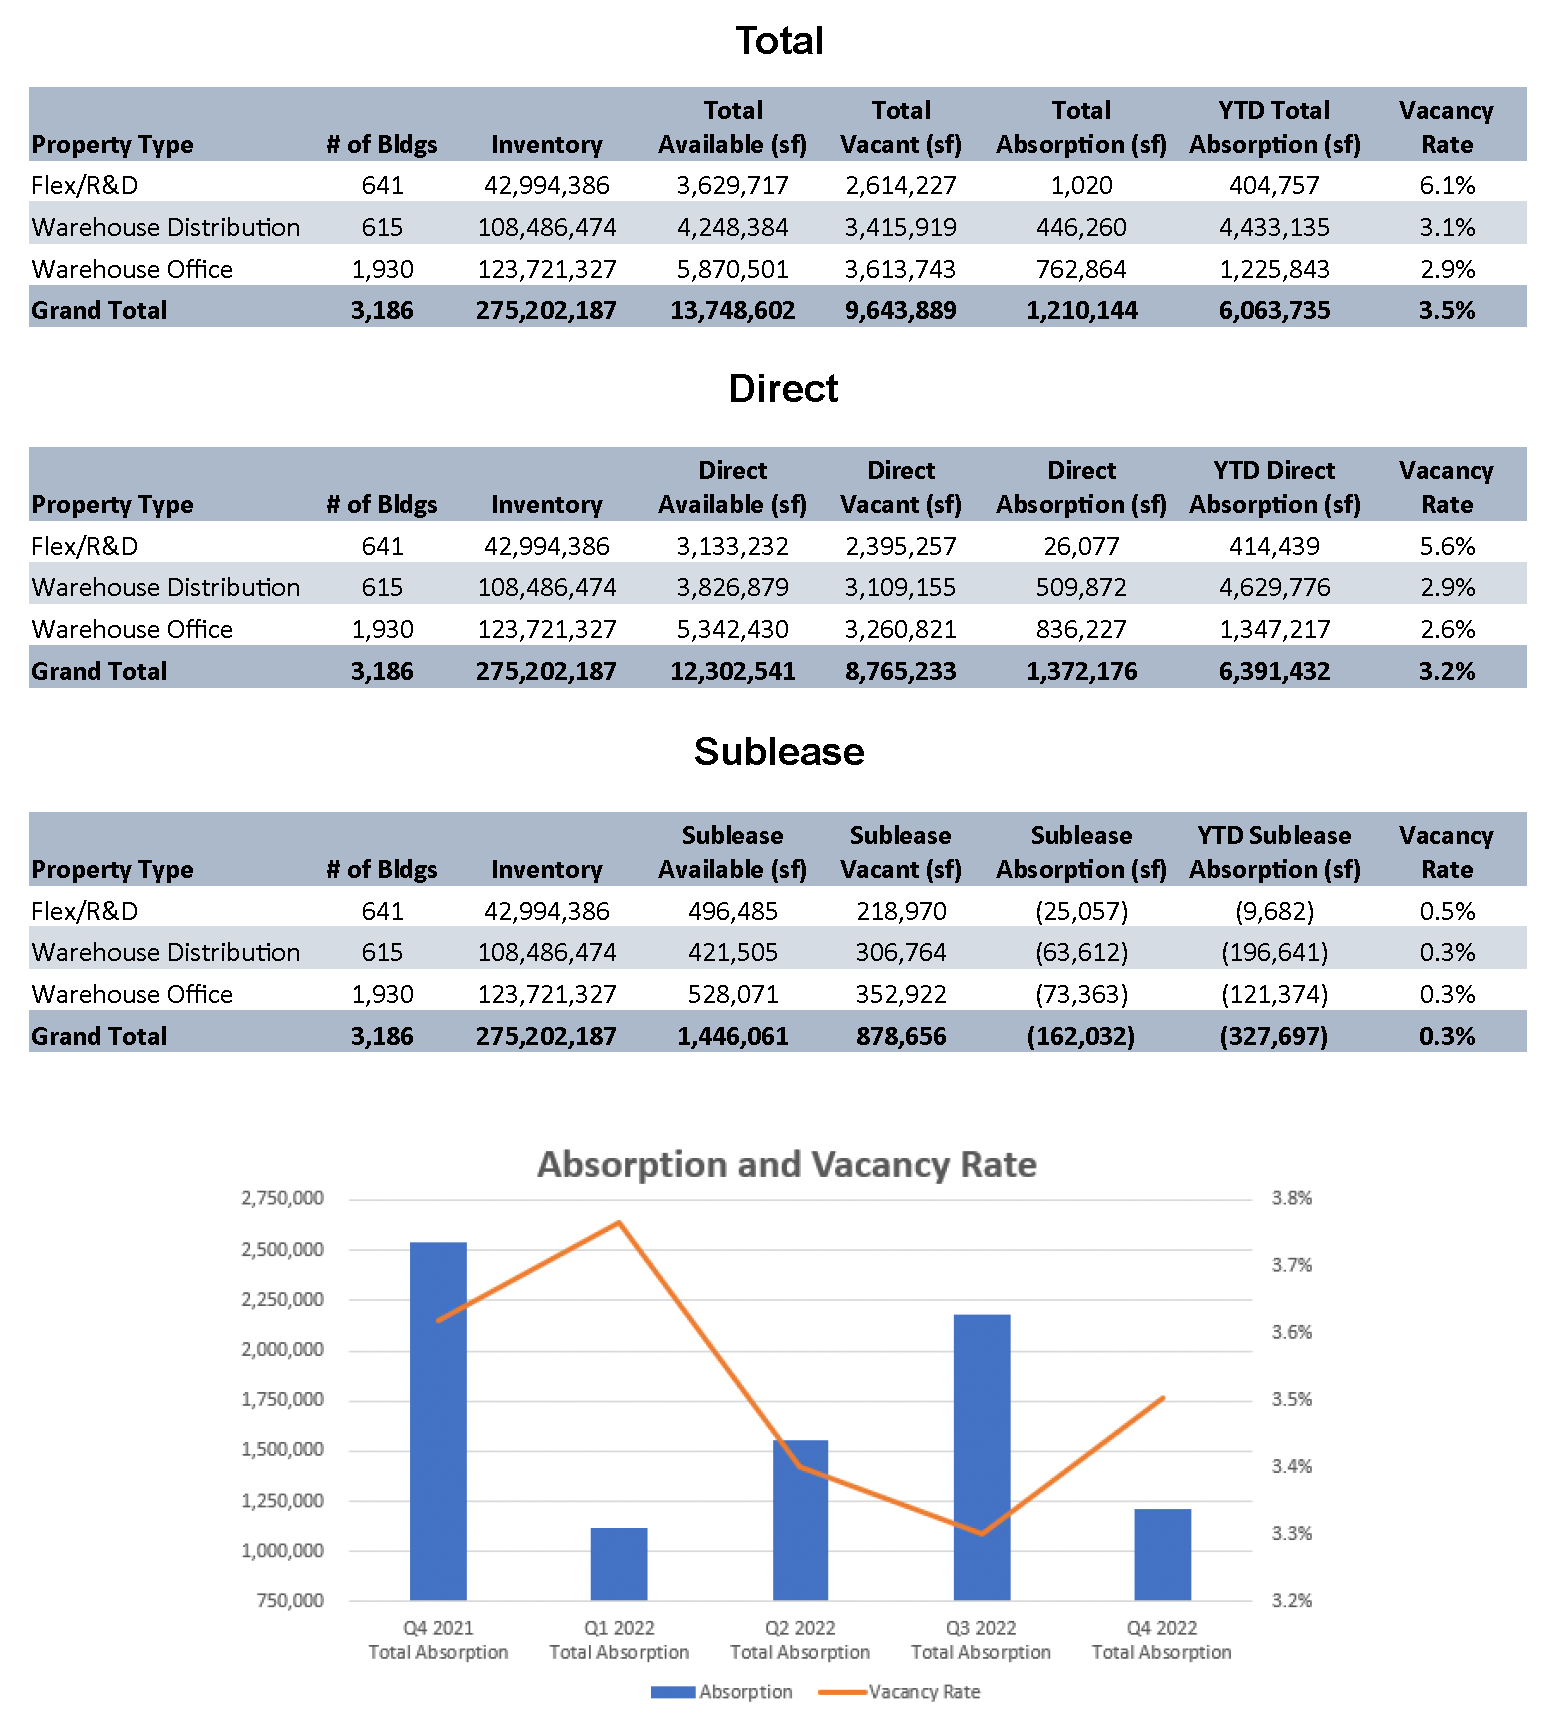
Market Stats by property type - industrial
VACANCY RATES BY MARKET
Multi and Single Tenant:
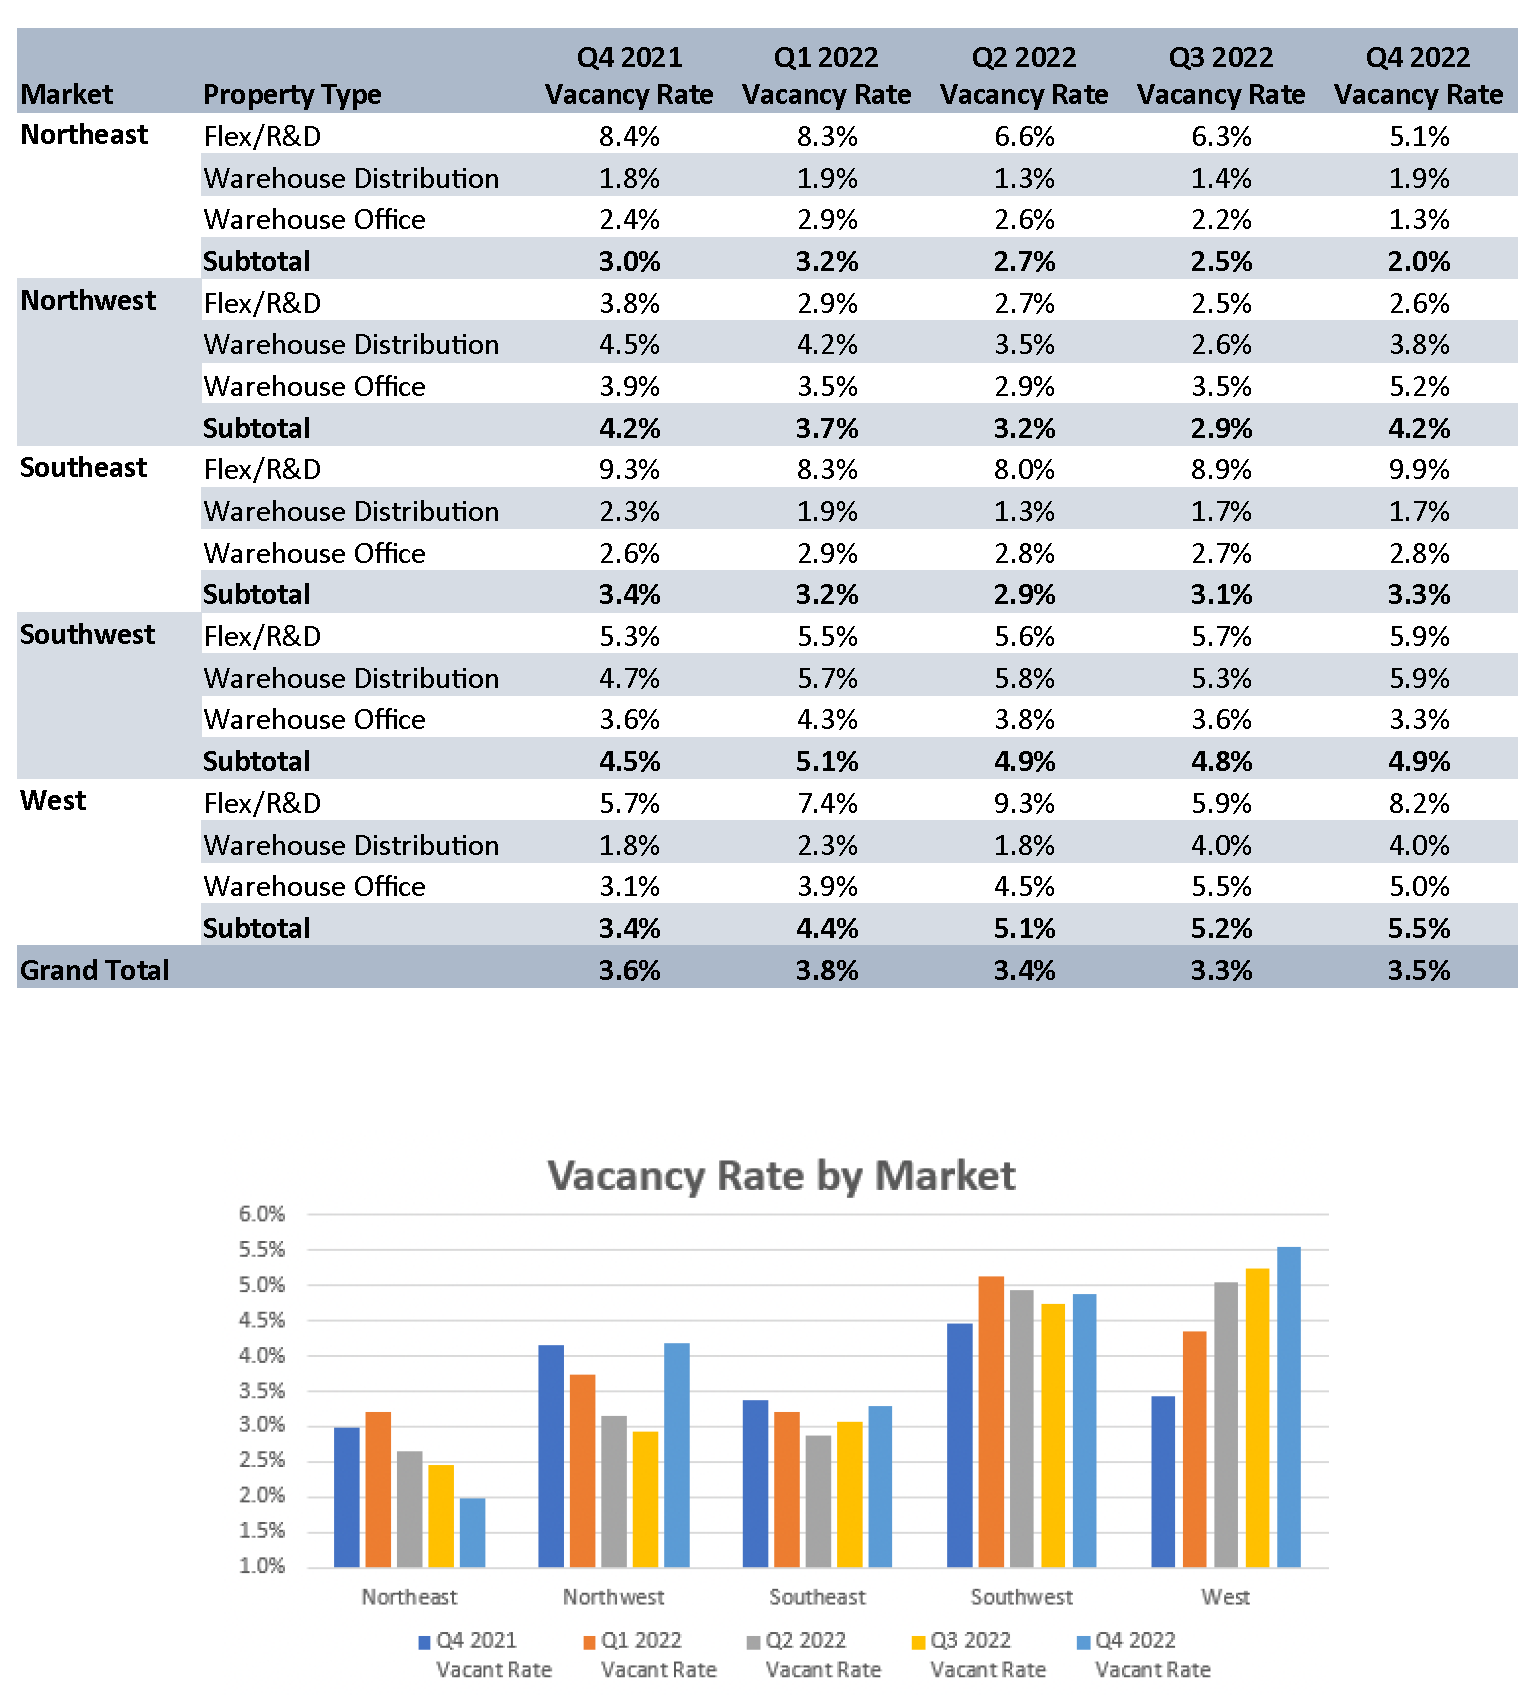
Vacancy Rate by Market - Industrial
LEASE RATES BY MARKET
Multi and Single Tenant NNN:
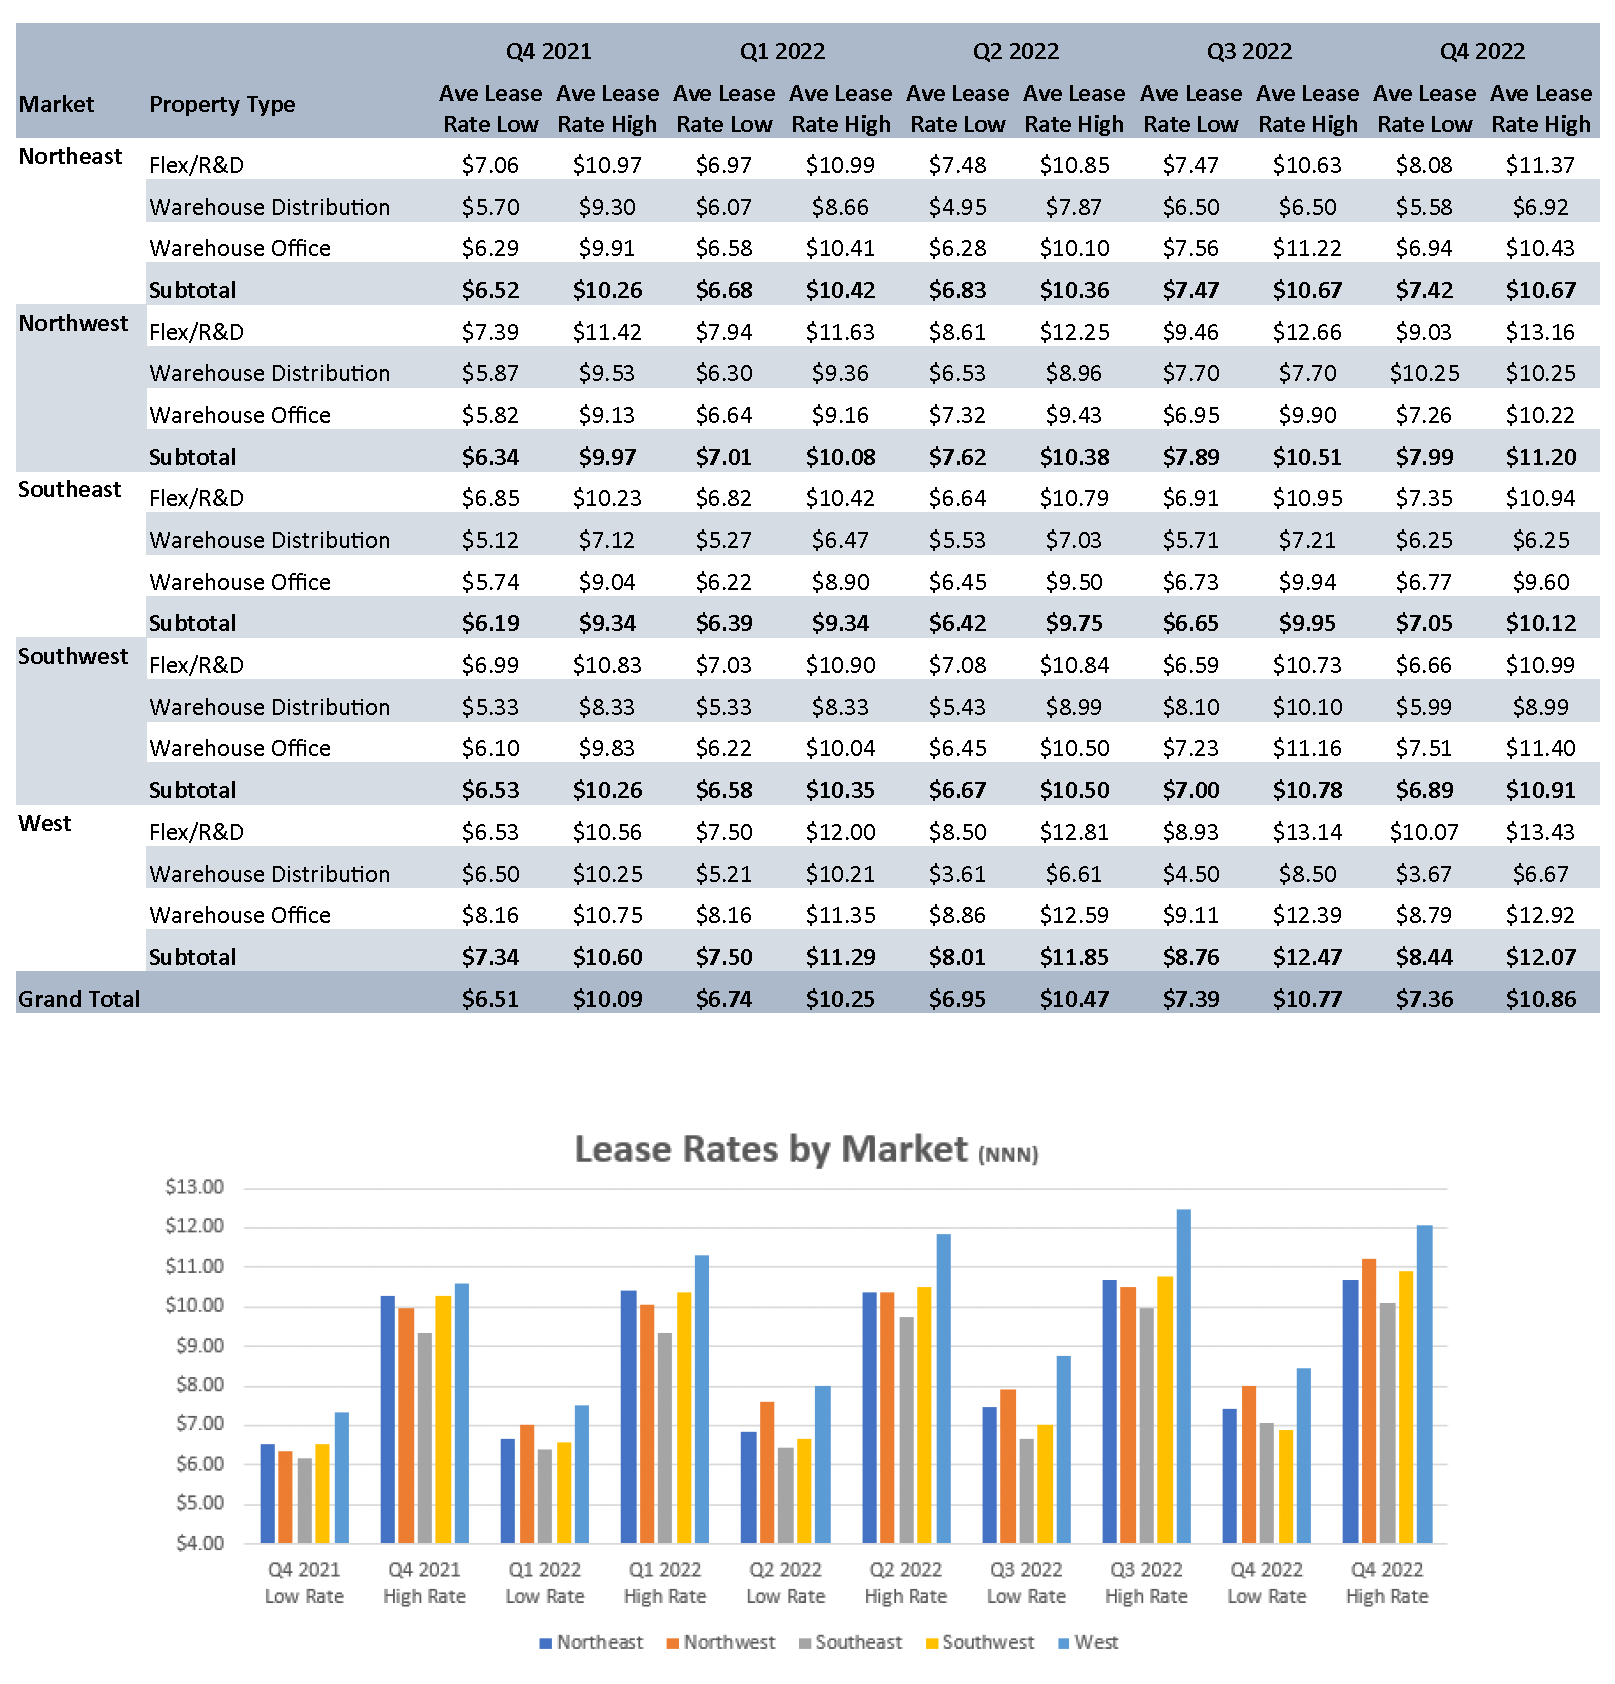
Lease Rates by Market - Industrial
MARKET STATISTICS BY PROPERTY TYPE
Multi Tenant:
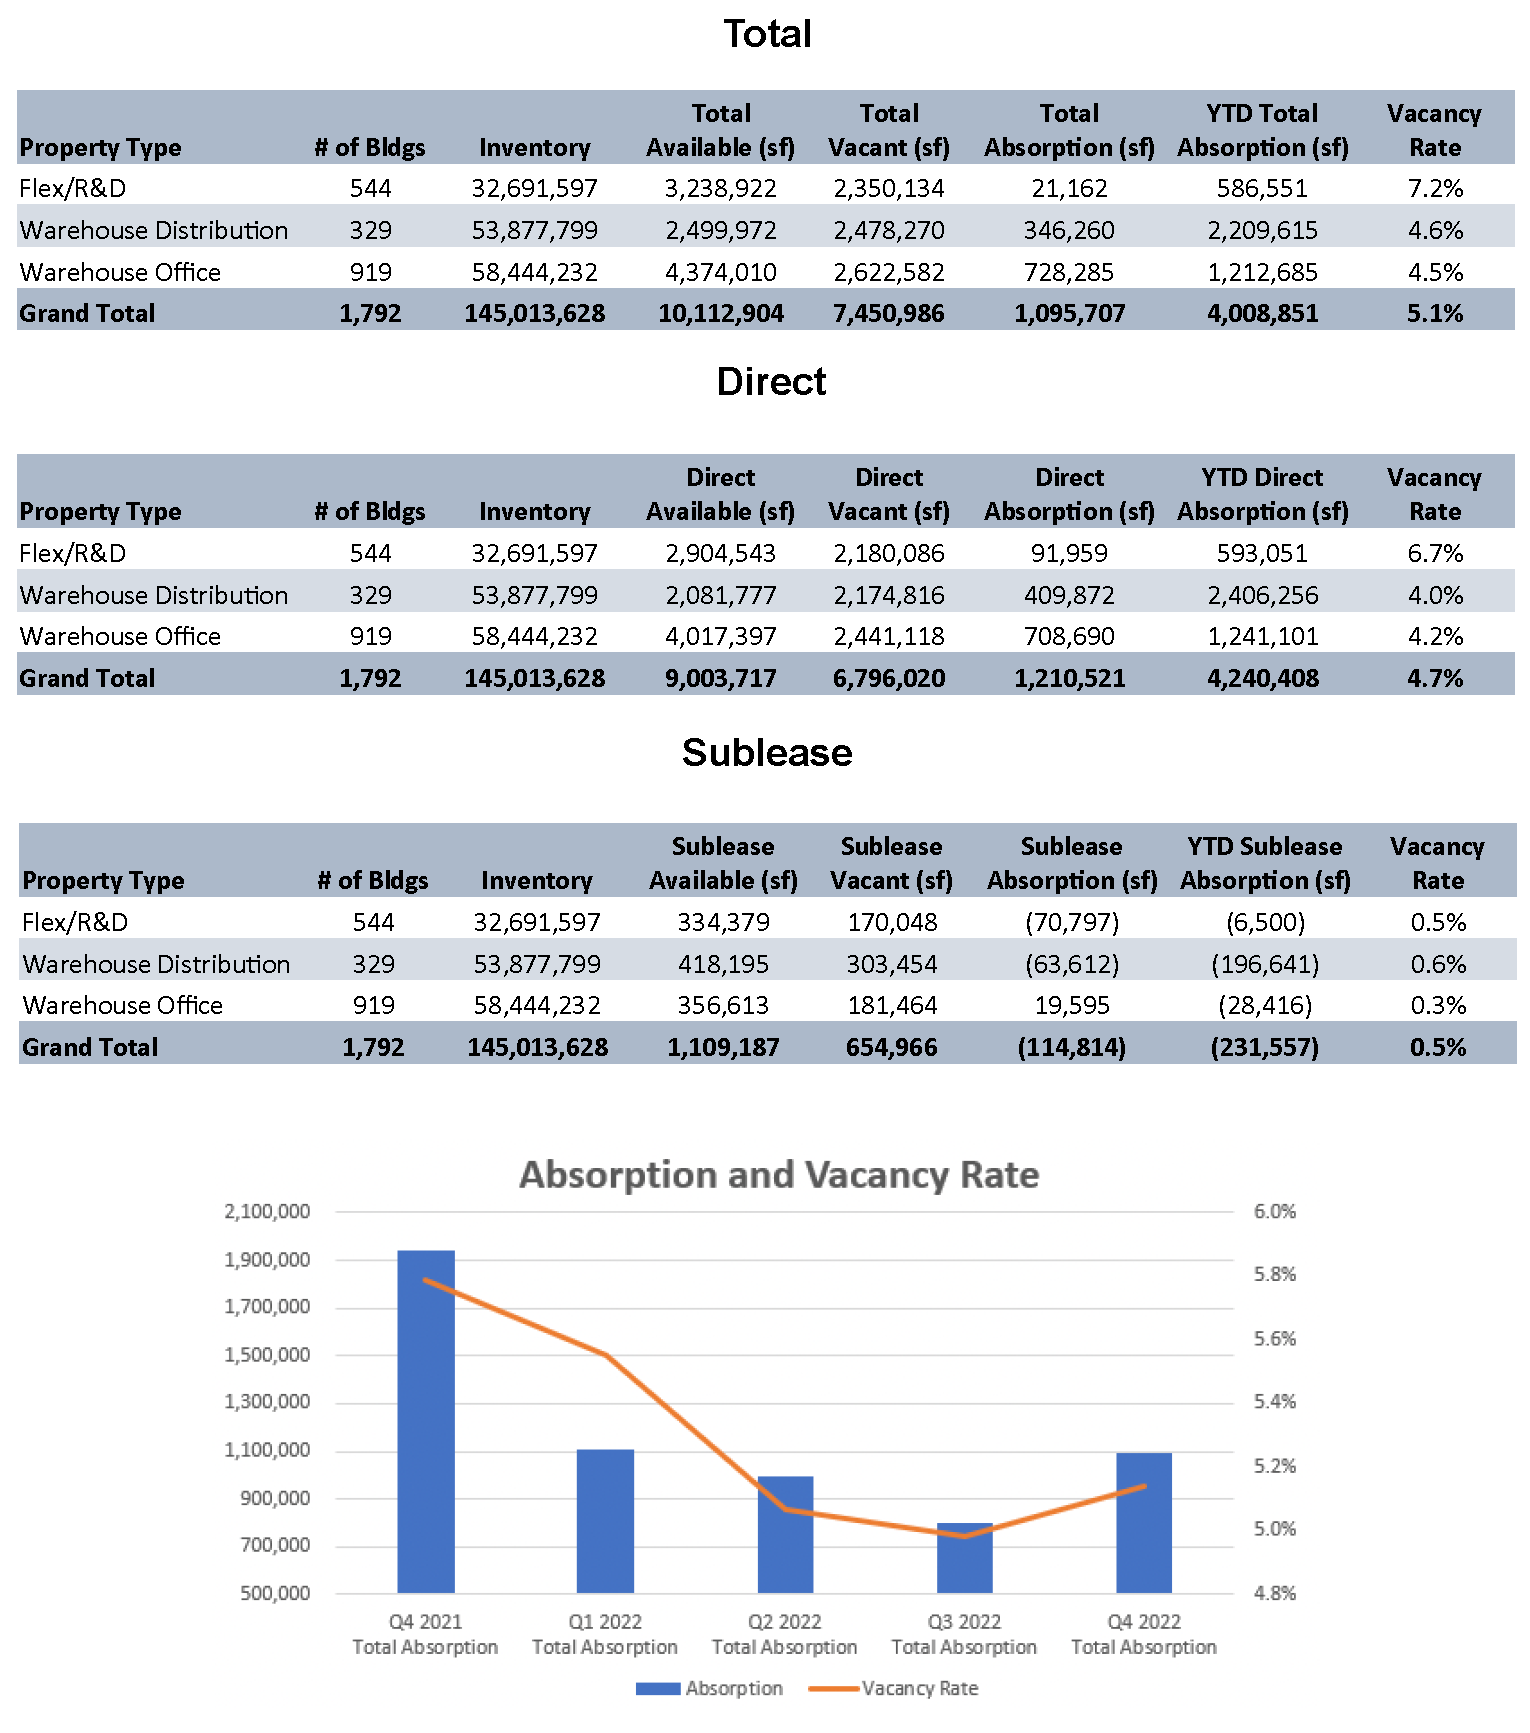
Market Statistcis by Property Type - Industrial
Q4-2022 Industrial Market Report created by Minnesota Commercial Real Estate Association. For more information you can reach them at: www.mncar.org
Q3 2021 Employment Rates

Industrial Market Experts

Phil Simonet

Phil Simonet

Principal

John Young, CCIM

John Young, CCIM

Vice President

Dan Lofgren

Dan Lofgren

Vice President

Joseph Schultz

Joseph Schultz

Senior Associate

Joe Jetland

Joe Jetland

Senior Associate

News & Updates

Q2 2024 Minneapolis-St. Paul Industrial Market Summary

Q2 2024 Minneapolis-St. Paul Industrial Market Summary

MARKET INSIGHTQ2 2024 Minneapolis-St. Paul Industrial Market SummaryForte's Vice President - Advisory, John Young, provides insight to the Twin Cities industrial market report recently released by MNCAR/REDI. Vacancy rates for industrial space are on the rise,...

Q2 2024 Minneapolis-St. Paul Office Market Summary

Q2 2024 Minneapolis-St. Paul Office Market Summary

MARKET INSIGHTQ2 2024 Minneapolis-St. Paul Office Market SummaryForte's Ericka Miller, Vice President Real Estate Advisory, provides insight to the Twin Cities office market report recently released by MNCAR/REDI. Low unemployment rates can often align with a strong...

Q1 2024 Minneapolis-St Paul Office Market Summary

Q1 2024 Minneapolis-St Paul Office Market Summary

MARKET INSIGHTQ1 2024 Minneapolis-St. Paul Office Market SummaryForte Principal, Jim Jetland, provides insight to the Twin Cities office market report recently released by MNCAR/REDI. While there are a few bright spots with the Twin Cities Office Market the general...

Loading...