MARKET INSIGHT POST
Q3-2023 Minneapolis-St. Paul Industrial Market Update

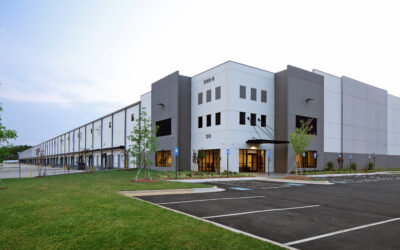
- Two significant areas to watch are the East Metro (Woodbury, Lake Elmo) area where over 1.2M square feet of spec construction has come online and with little absorption of any of the new space. Cottage Grove as an untested multi-tenant market with over 1M square feet of new development and, to date, very little absorption mirrors the East Metro.
Q3-2023 Minneapolis-St. Paul Industrial Market Update
MARKET RECAP:
ECONOMIC OVERVIEW:
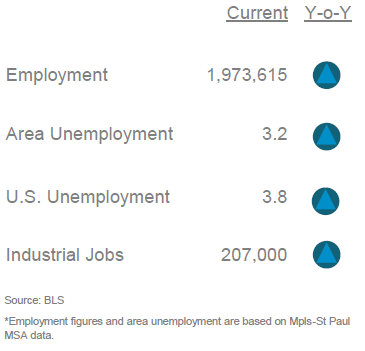
MPLS-ST. PAUL AREA EMPLOYMENT STATS:
MARKET OVERVIEW:
MARKET HIGHLIGHTS:
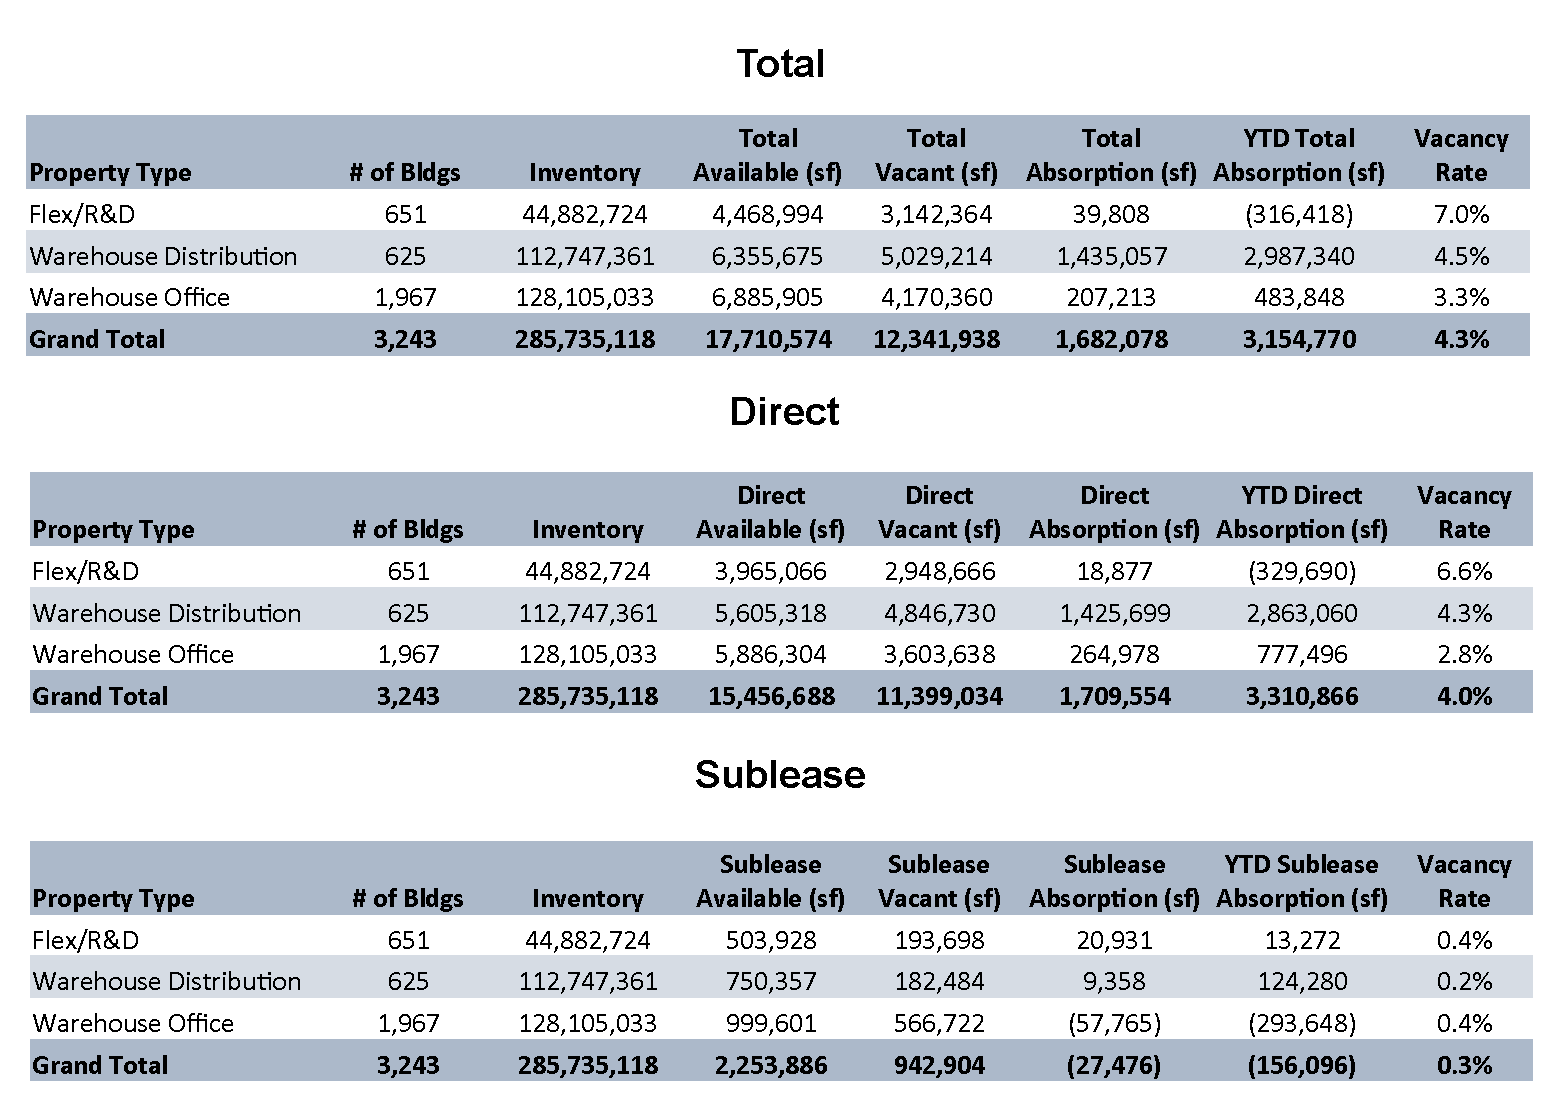
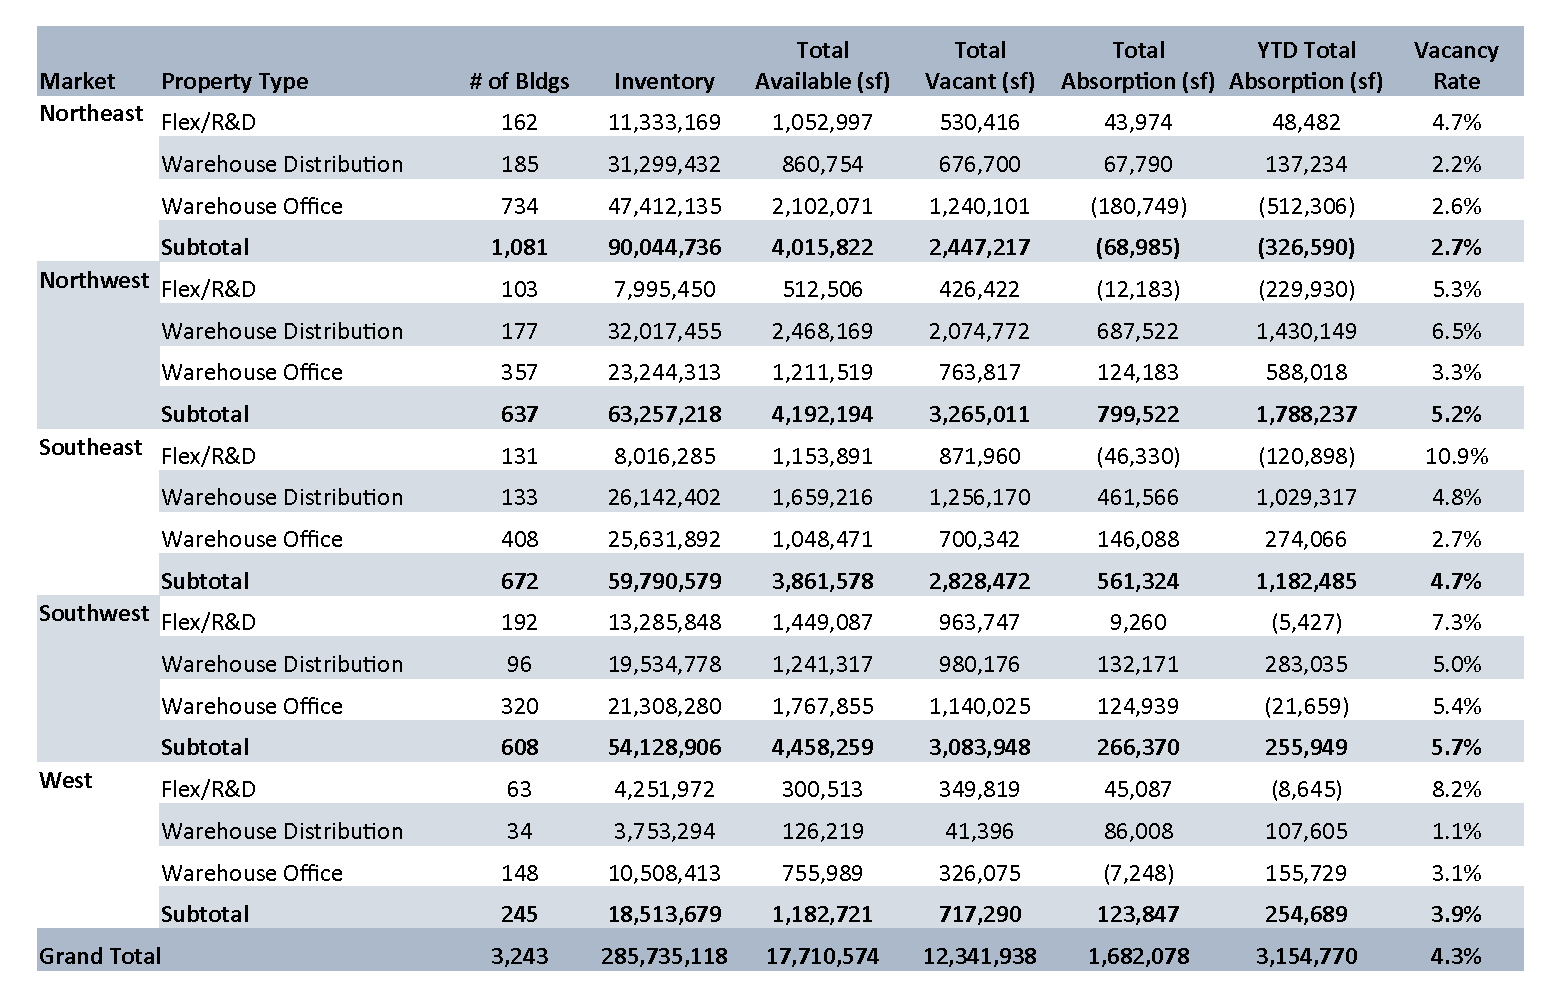
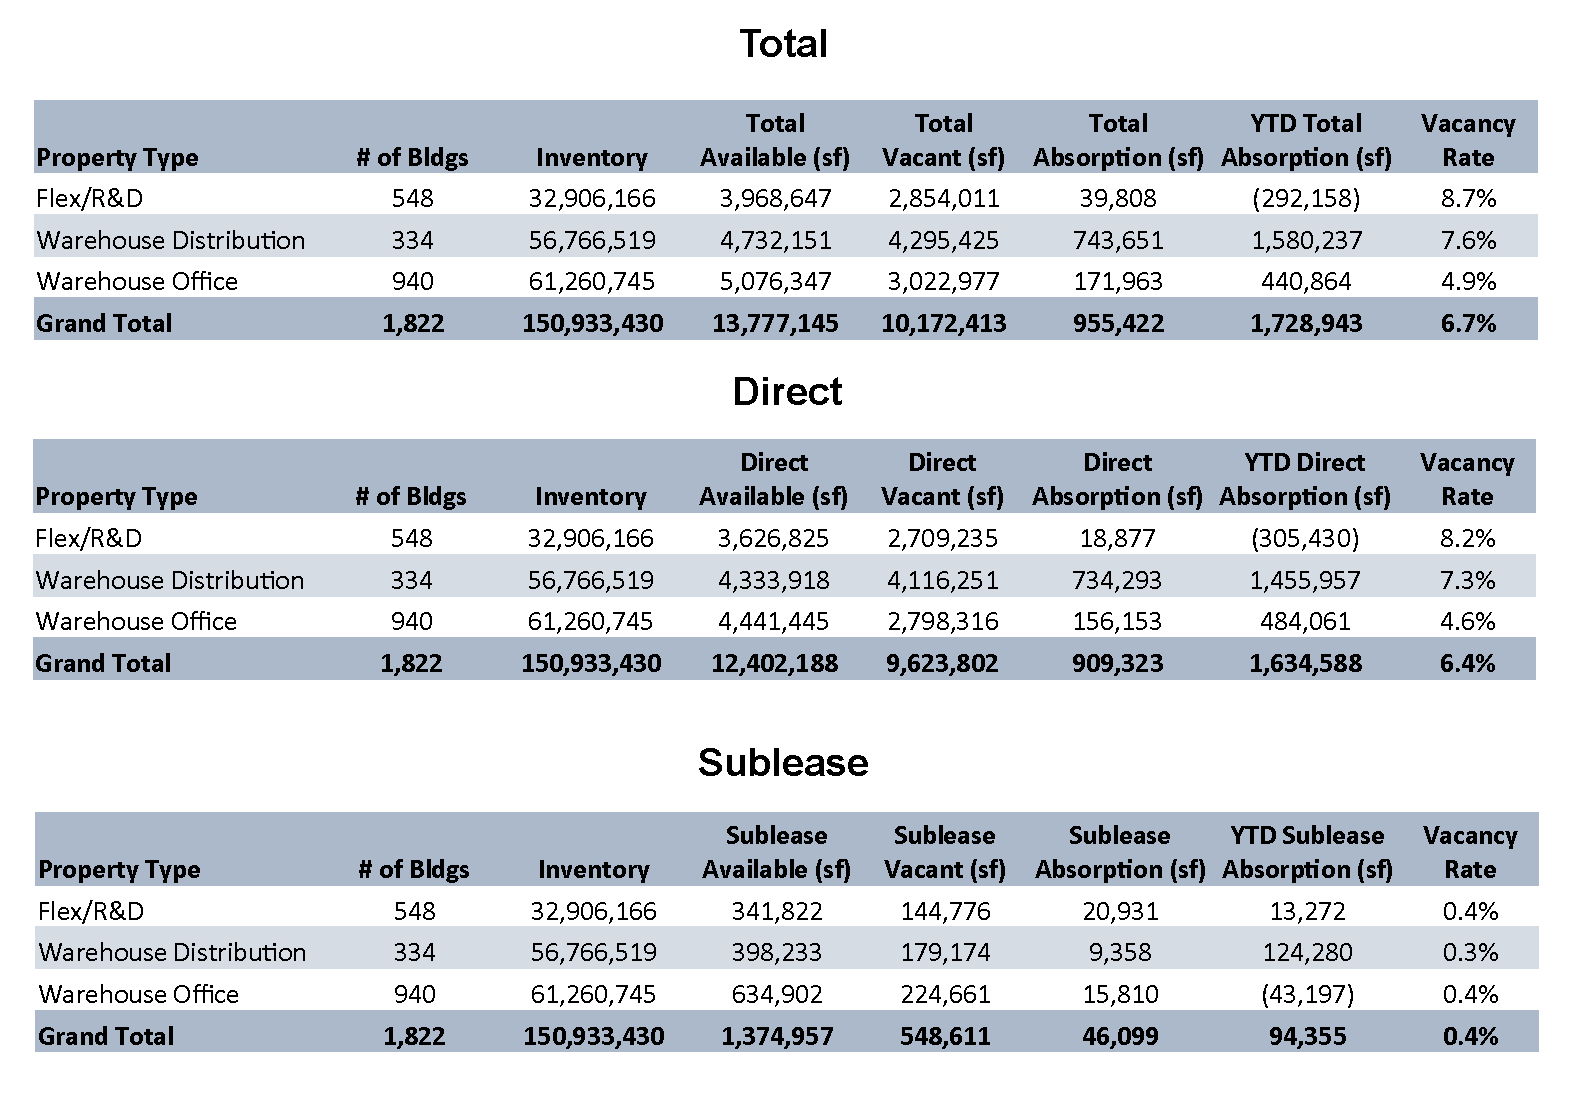
MARKET STATISTICS BY PROPERTY TYPE
Multi and Single Tenant:
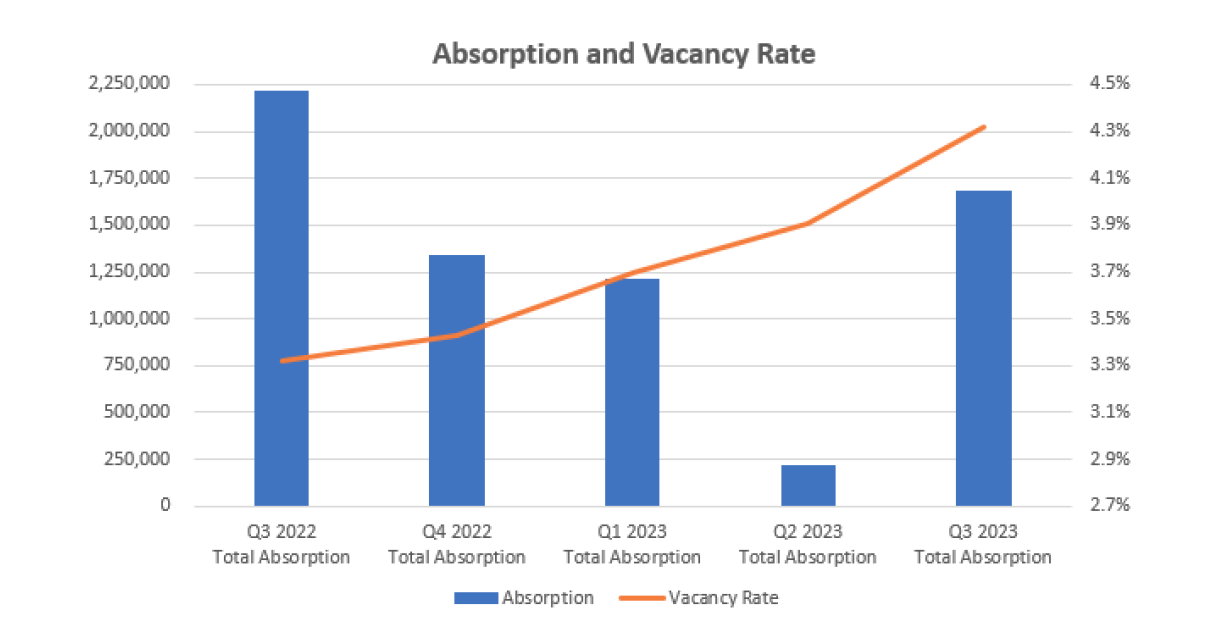
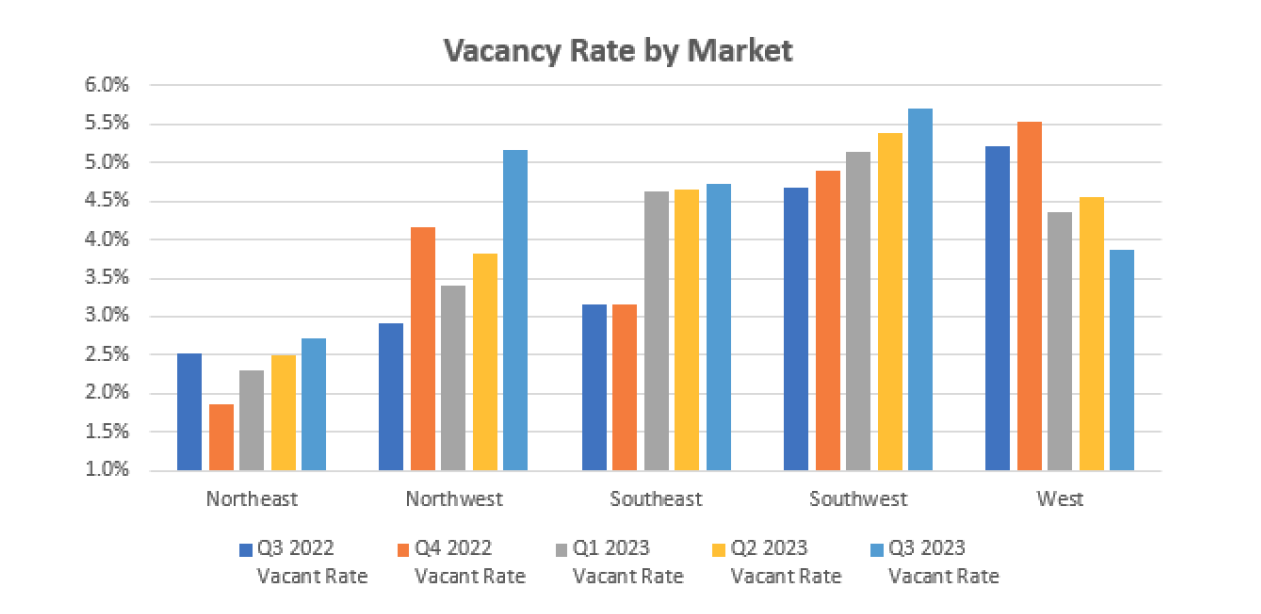
VACANCY RATES BY MARKET
Multi and Single Tenant:
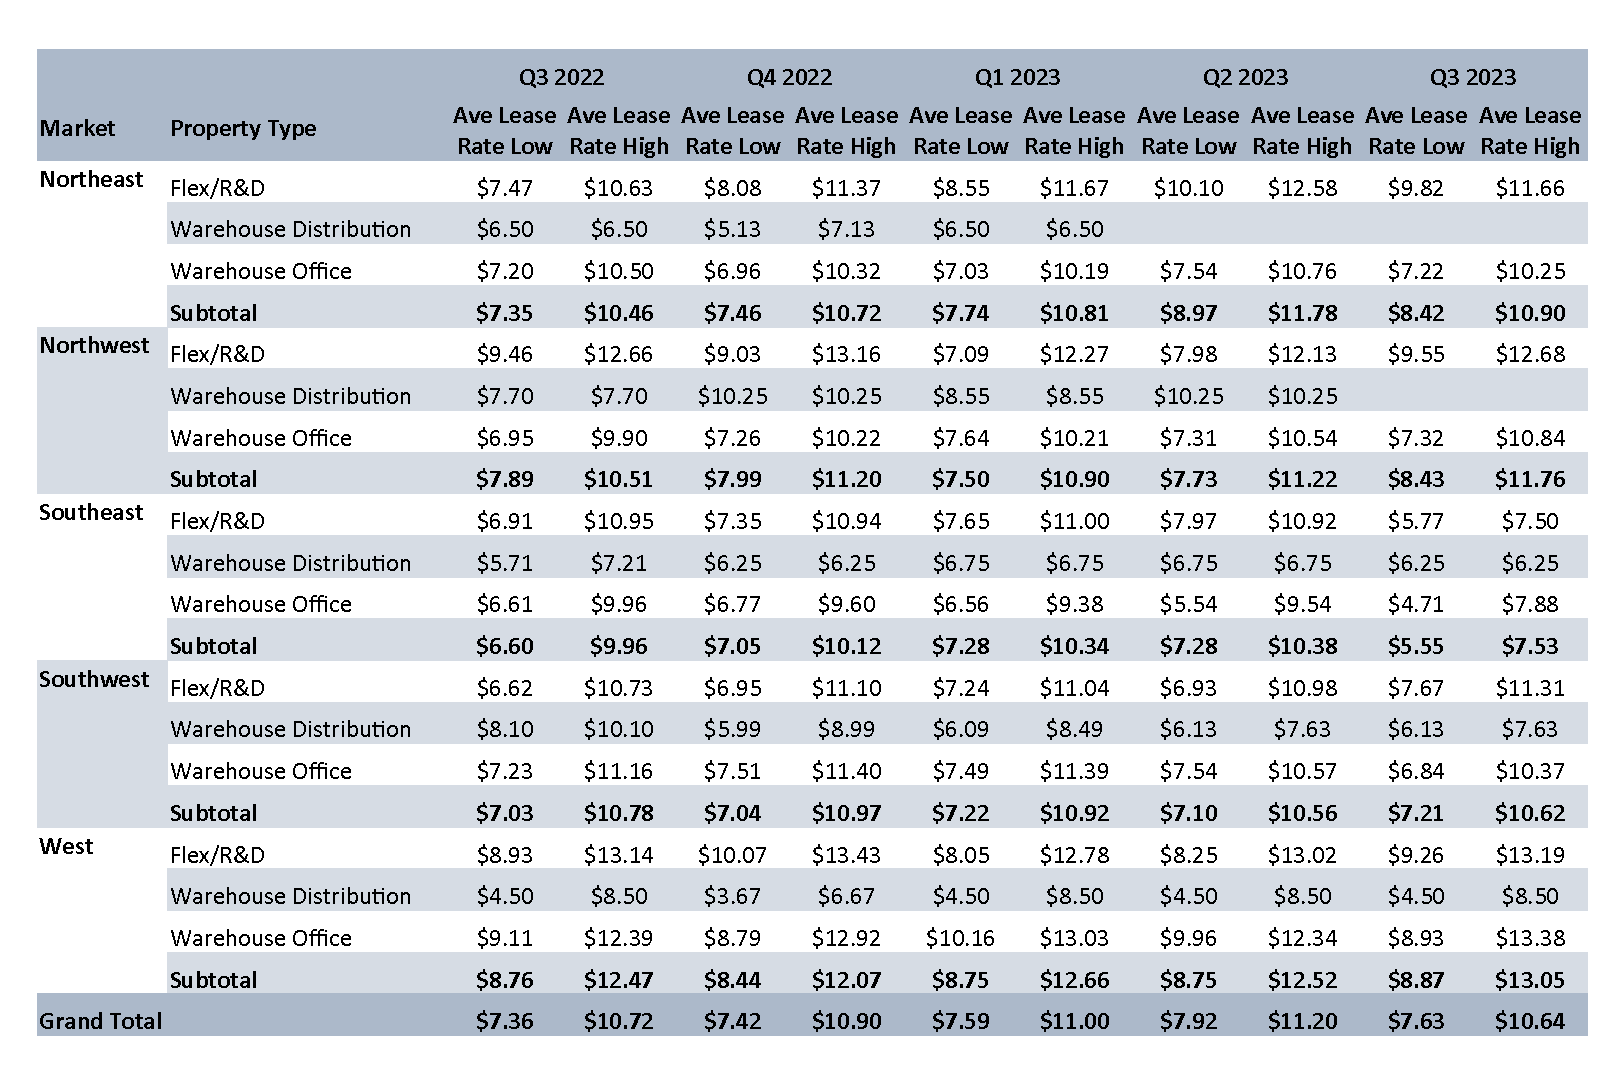
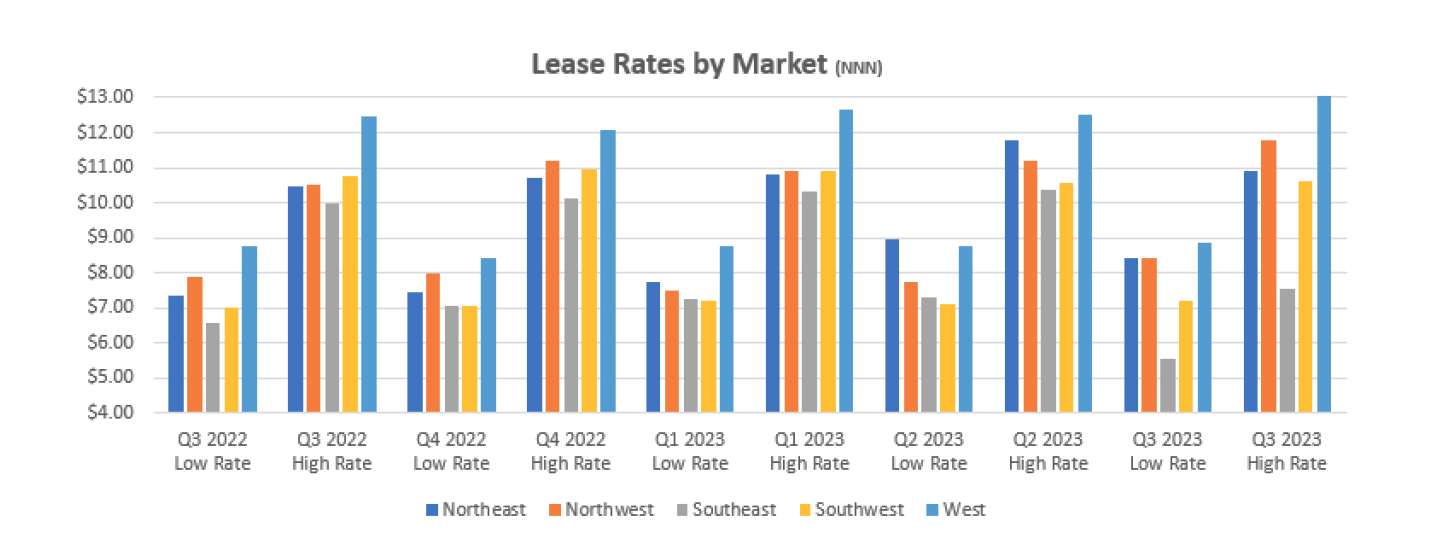
LEASE RATES BY MARKET
Multi and Single Tenant NNN:
MARKET STATISTICS BY PROPERTY TYPE
Multi Tenant:
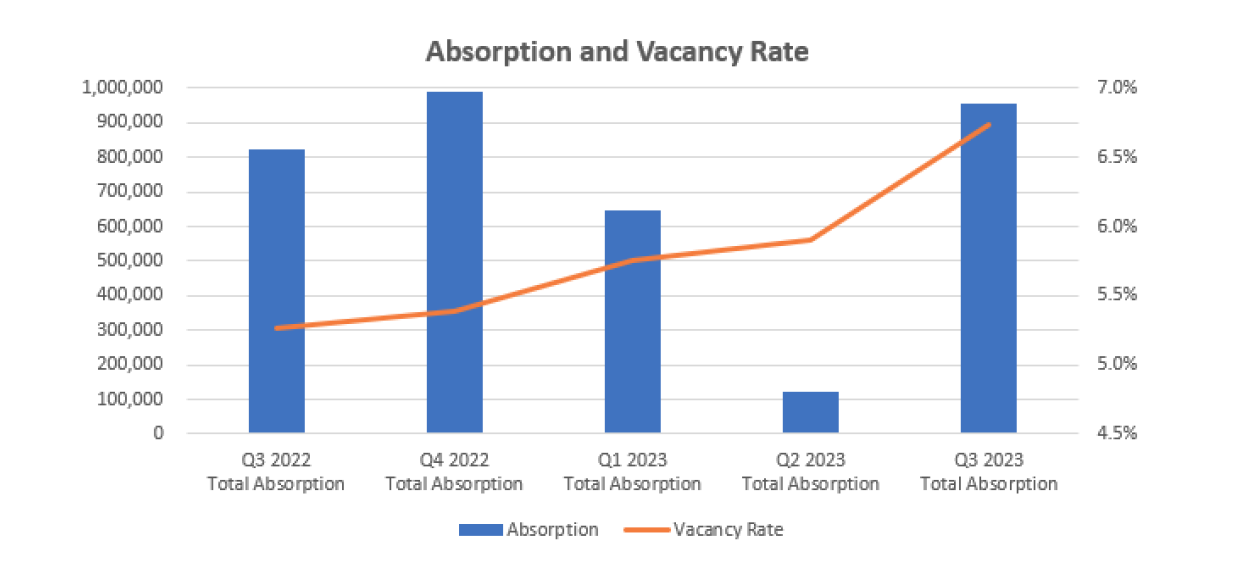
NEW DEVELOPMENTS BY MARKET:
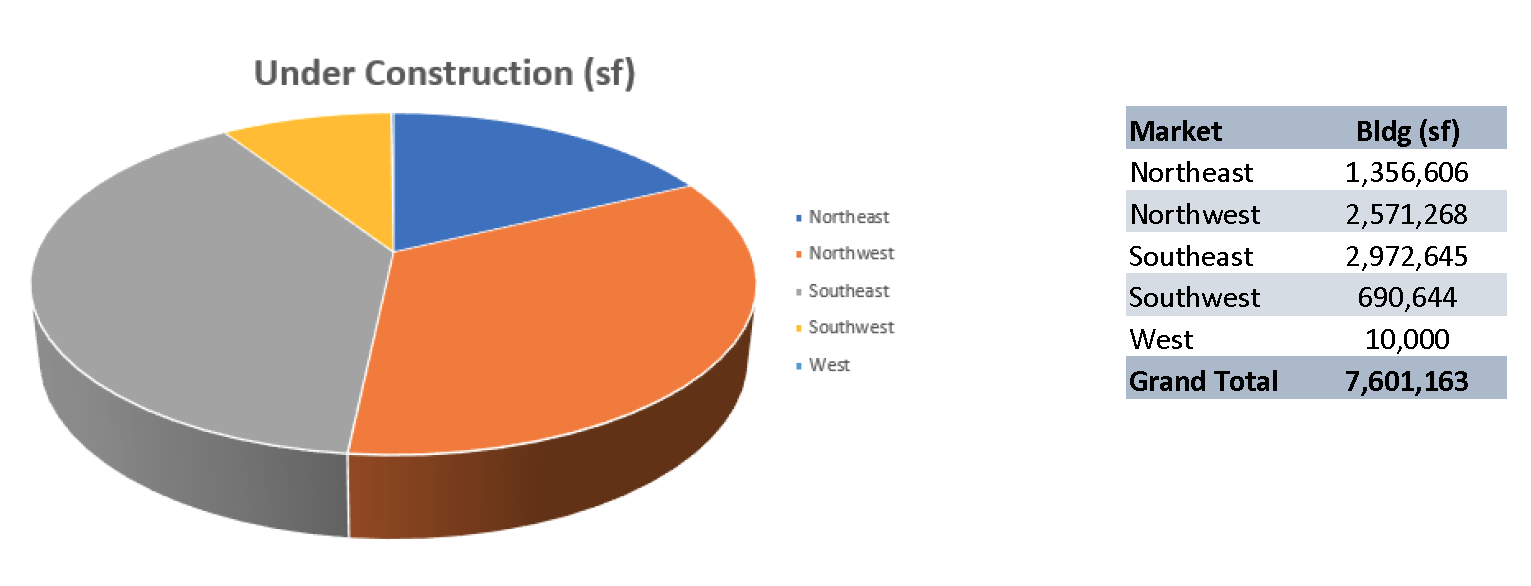
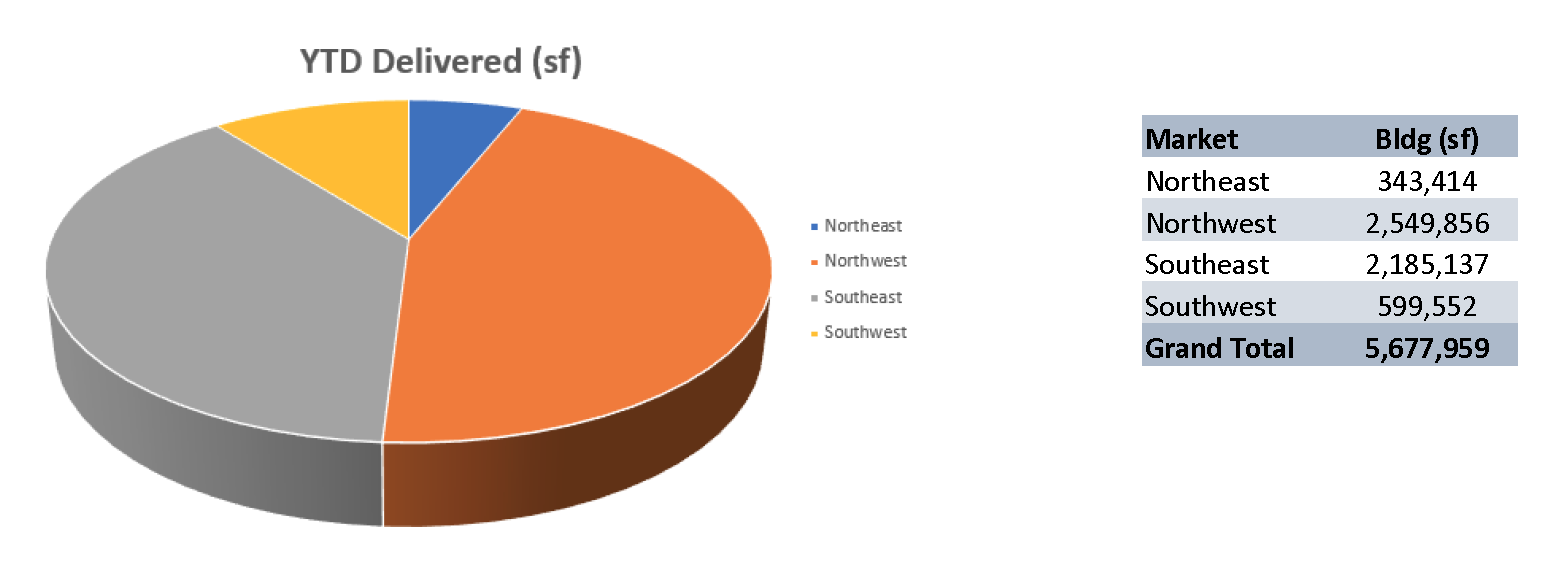
YEAR-TO-DATE DELIVERIES BY MARKET:
Market Insight
Industrial Market Experts


News & Updates
Q1 2025 Minneapolis-St. Paul Office Market Summary
MARKET INSIGHTQ1 2025 Minneapolis-St. Paul Office Market SummaryFuture of Twin Cities Office Space: Smaller, Smarter, and Sustainable Forte’s Kate Damato, Senior Associate-Real Estate Advisory, provides insight to the Twin Cities office market report recently...
Q1 2025 Minneapolis-St. Paul Industrial Market Summary
MARKET INSIGHTQ1 2025 Minneapolis-St. Paul Industrial Market SummaryTwin Cities industrial market enters 2025 with sustained momentum in absorption and decreasing vacancy By: Erik Nordstrom, Senior Associate-Real Estate Advisory provides insight to the Twin Cities...
Q4 2024 Minneapolis-St. Paul Industrial Market Summary
MARKET INSIGHTQ4 2024 Minneapolis-St. Paul Industrial Market SummaryTwin Cities Industrial market ends 2024 with strong occupancy but weak warehouse office absorption By: John Young, CCIM, Vice President - Real Estate Advisory The Twin Cities industrial market...


