MARKET INSIGHT
Q2 2024 Minneapolis-St. Paul Industrial Market Summary

Forte’s Vice President – Advisory, John Young, provides insight to the Twin Cities industrial market report recently released by MNCAR/REDI.
Vacancy rates for industrial space are on the rise, signaling a shift in the market dynamics. After several years of tight inventory and brisk leasing activity, there are signs of moderation. This is not a slow-down, but instead, it is a cooling off of the previously high rate of new leases. Market total vacancy rates climbed to 5.3% in the second quarter of 2024. This is significant considering the very same measure of vacancy was 3.9% in the second quarter of 2023. Slowly and steadily vacancy rates have climbed, but there has been no decrease in lease rates. Quite the contrary, net lease rates for industrial space continue to remain strong and, in some situations, are increasing.
The Twin Cities industrial market contains 295 million square feet of building space. Almost 16 million square feet is vacant, and the market absorbed (absorption is the net change in occupancy measured in square feet) 228,000 square feet in the second quarter for a year-to-date total of almost 1.2 million square feet absorbed. One factor in reduced absorption is warehouse-distribution (over 24’ clear height) buildings in outlying suburbs have remained vacant over the last 12 months. This could be defined as over-development or a moderation of demand by users for this product type. Either way, expectations are, leasing and sale activity will pick up after the presidential election and cuts in interest rates.
Q2-2024 Minneapolis-St. Paul Industrial Market Summary
MARKET RECAP:
All Properties:
Total Inventory: 295,421,375 sf
Total # of Buildings: 3,309
Absorption: 228,025 sf
Vacancy: 5.3%
Asking Rate Low: $8.43 NNN
Asking Rate High: $11.17 NNN
Under Construction: 3,294,792 sf
Multi-Tenant Properties
Total Inventory: 154,706,162 sf
Total # of Buildings: 1,844
Absorption: (48,520) sf
Vacancy: 8.0%
Asking Rate Low: $8.63
Asking Rate High: $11.38
ECONOMIC OVERVIEW:
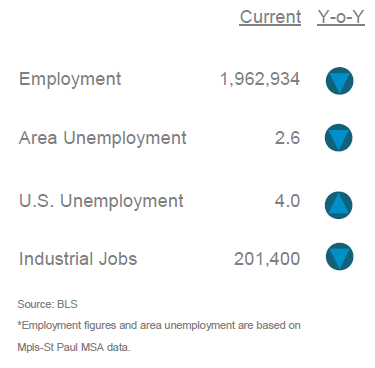
According to the Bureau of Labor Statistics (BLS), the unemployment rate for the Mpls-St Paul metropolitan statistical area (MSA) decreased 30 basis points to 2.6% for May 2024 from 2.9% for May 2023. The unemployment rate for the US was at 4.0% in May 2024 increasing 30 basis points from last year. State of Minnesota unemployment rate was 2.8%. The Mpls-St Paul MSA saw an decrease in job growth while industrial specific jobs decreased in job growth in manufacturing by 1,000 during the same period.
MPLS-ST. PAUL AREA EMPLOYMENT STATS:

MARKET OVERVIEW:
The Mpls-St Paul industrial market consists of 295.4 msf in eight counties across the metro. Overall, there was 228,000 sf of positive absorption for Q2 2024, bringing the YTD to 1.1 msf positive absorption. Multi-tenant only properties posted (48,500) sf negative absorption bringing the YTD to 550,200 sf positive absorption. The overall vacancy rate for the quarter was 5.3% and multi-tenant properties vacancy rate was 8.0%. To date, there are 29 construction projects throughout the market totaling 3.3 msf and 30 properties have been delivered this year with 3.1 msf.
MARKET HIGHLIGHTS:
At the close of Q2 2024, the market experienced 2.3 msf of leasing activity in 159 transactions. The West market showed the lowest vacancy rate of 3.1% while the Southwest market is at the top with 6.8% for all properties. The Southeast bested all markets with 456,700 sf positive absorption led by the new delivery of Natural American Foods leasing 360,000 sf. The Southwest market posted the most negative absorption of (176,200) sf led by Cokem vacating 162,700 sf. One hundred properties sold totaling 6.9 msf for $624.1 million.
MARKET MAP:

Q2 2024 Industrial Market Report is created by Minnesota Commercial Real Estate Association. For more information, you can reach them at: www.mncar.org
Market Insight
Get access to all future Industrial Market Reports below
Industrial Market Experts


News & Updates
Expert Q&A-How Companies Can Prepare For the Next Downturn
NEWS POSTQ&A-How Companies Can Prepare for the Next DownturnNavigating Real Estate in an Uncertain EconomyExpert Q & A with Forte Leadership-Jim Jetland, SIOR-principal; Steve Brown, CCIM-principal, Phil Simonet-principal, and Paul Donovan-COOForte’s...
Q2 2025 Minneapolis-St. Paul Office Market Summary
MARKET INSIGHTQ2 2025 Minneapolis-St. Paul Office Market Summary Q2 2025 Twin Cities Office Insights: A Tale of Two Markets Forte’s Erik Nordstrom, Senior Associate-Real Estate Advisory, provides insight to the Twin Cities office market report recently released by...
Q1 2025 Minneapolis-St. Paul Office Market Summary
MARKET INSIGHTQ1 2025 Minneapolis-St. Paul Office Market SummaryFuture of Twin Cities Office Space: Smaller, Smarter, and Sustainable Forte’s Kate Damato, Senior Associate-Real Estate Advisory, provides insight to the Twin Cities office market report recently...


