(952) 854-8290 info@forterep.com

MARKET INSIGHT POST

Q1-2023 Minneapolis-St. Paul Industrial Market Update
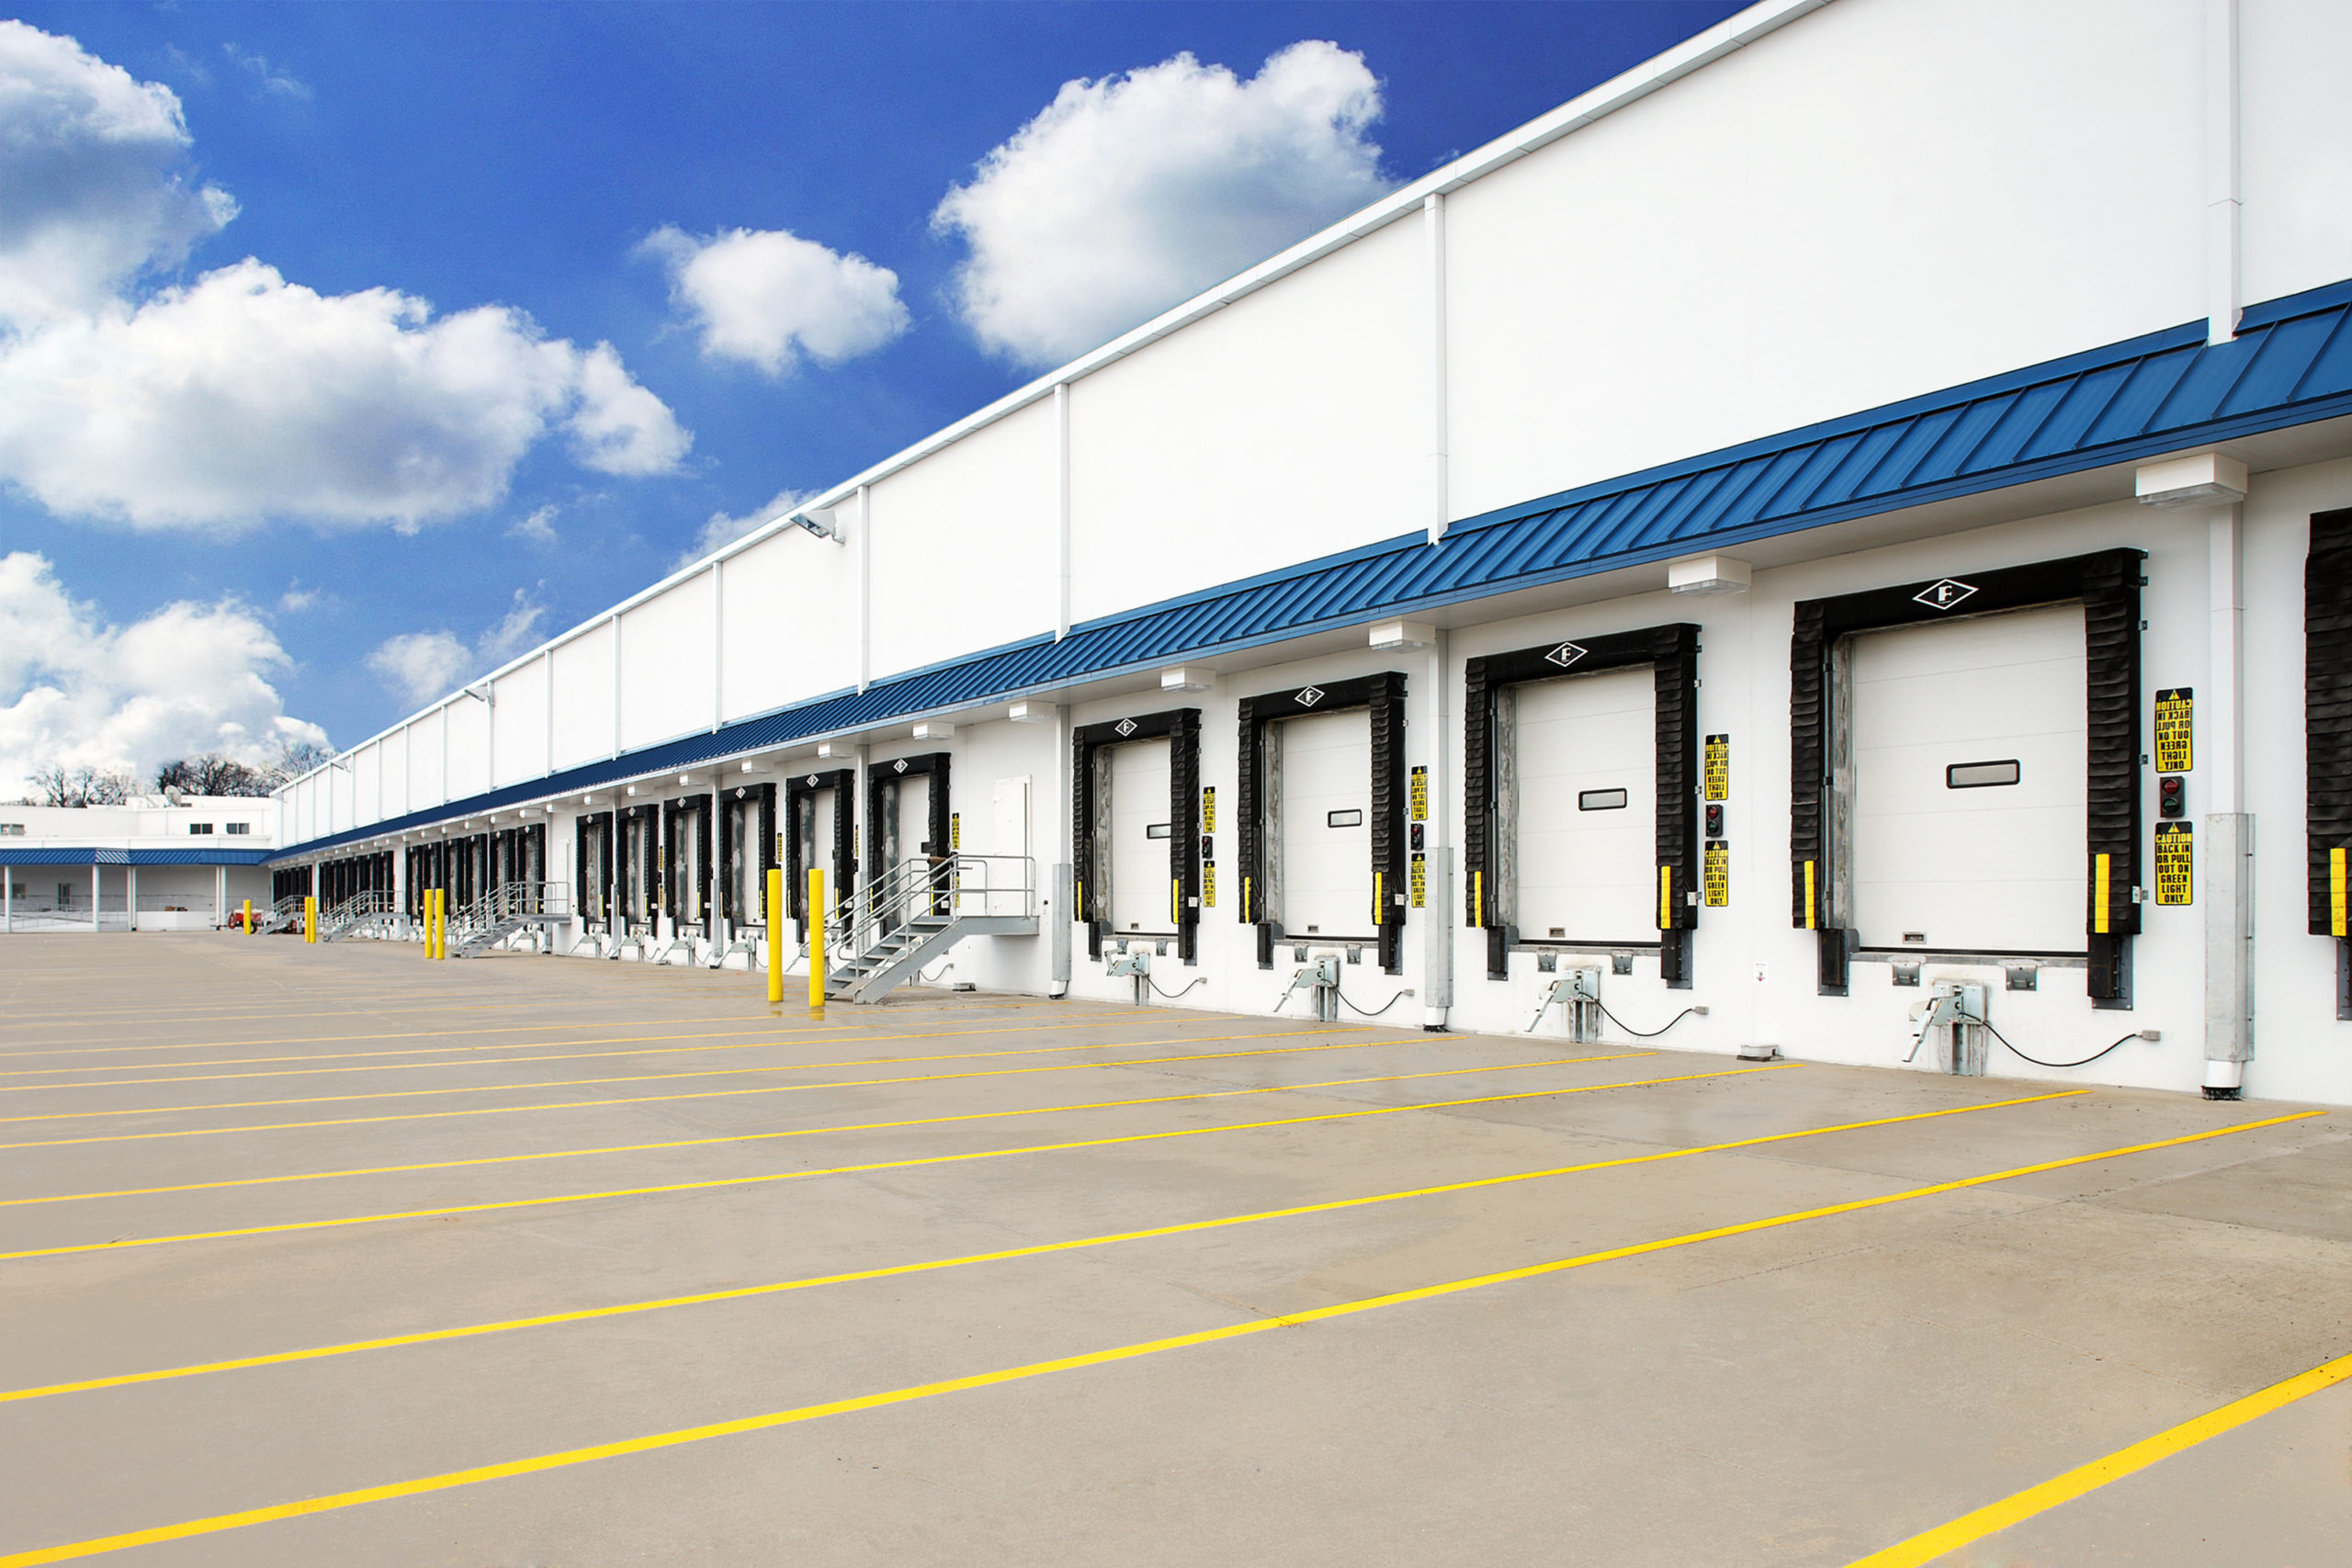
Q4 2022 Industrial Market Update Building Image
Forte Principal, Phil Simonet, provides insight to the Twin Cities industrial market report recently released by MNCAR/REDI.


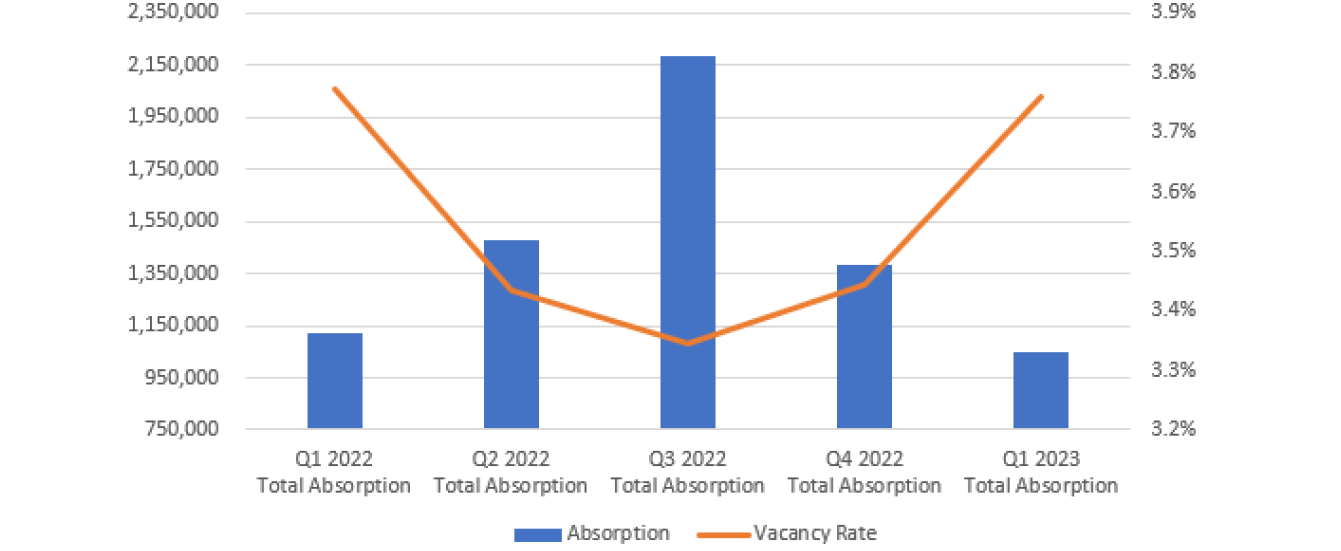
Once again, the Twin City industrial market proved resilient with a strong first quarter of activity. Net absorption for Q1 2023 was 1,050,738 with an overall market vacancy rate of 3.8%. In comparison, Q4, 2022 net absorption was 1,210,144 square feet and the year-end overall industrial vacancy rate was 3.5%. While the vacancy rate experienced a slight increase, market fundamentals remain strong with excellent leasing activity in most submarkets, particularly 24’ clear and above buildings. Net rental rates continue to show impressive strength with year over year increases of 7.3% for office space and 12.46% for warehouse space. The exception to the overall positive industrial performance is the weakest industrial product type, office showroom which experienced negative net absorption of 125,348 square feet and a current vacancy rate of 6.7%. As expected, heavier finish industrial space has been far more negatively impacted from COVID-19 with little improvement anticipated over the balance of 2023.

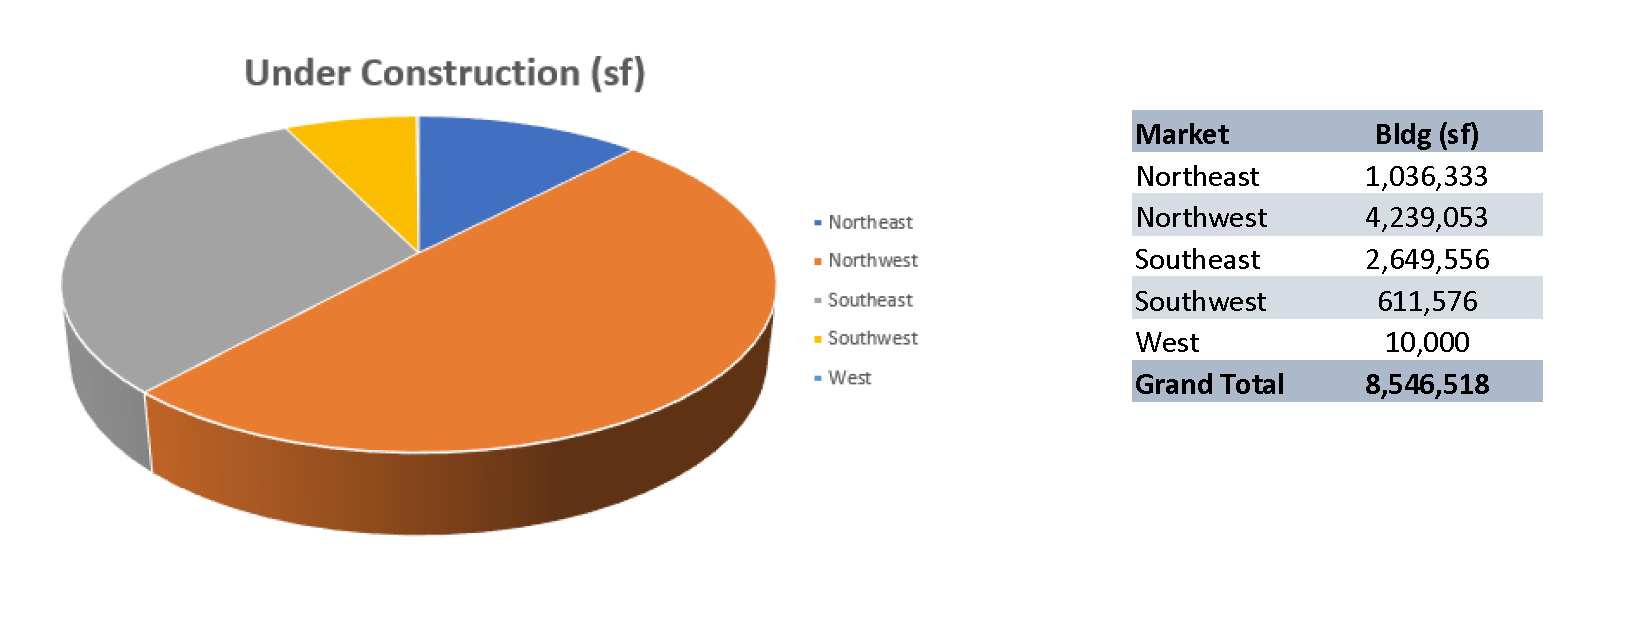
New construction remains robust with 8.5 million square feet under construction in the pipeline. Rising interest rates appear to be impacting future spec developments as the cost of financing, lender underwriting and exit CAP rates have made it more difficult and riskier to continue the last several years of record breaking new/spec development. The first signs of moderation in spec develop is the recent shortened timeframe when ordering tilt-up concrete panels-clearly a sign of less demand by developers.

There are potential head winds that may impact the performance of the Twin City industrial market including the uncertainty of the US economy as demonstrated by the Q1 2023 GDP of only 1.1%, the potential reality of another banking/credit crisis set about by rising interest rates, poor internal bank management and ineffective federal regulator oversite, and finally the continued worker shortage restraining business growth across many sectors of the economy.

Q1-2023 Minneapolis-St. Paul Industrial Market Update

MARKET RECAP:
All Properties:

Total Inventory: 279,416,932 sf

Total # of Buildings: 3,210

Absorption: 1,050,738 sf

Vacancy: 3.8%

Asking Rate Low: $7.58 NNN

Asking Rate High: $11.00 NNN

Under Construction: 8,546,518 sf


Multi-Tenant Properties

Total Inventory: 147,980,030 sf

Total # of Buildings: 1,809

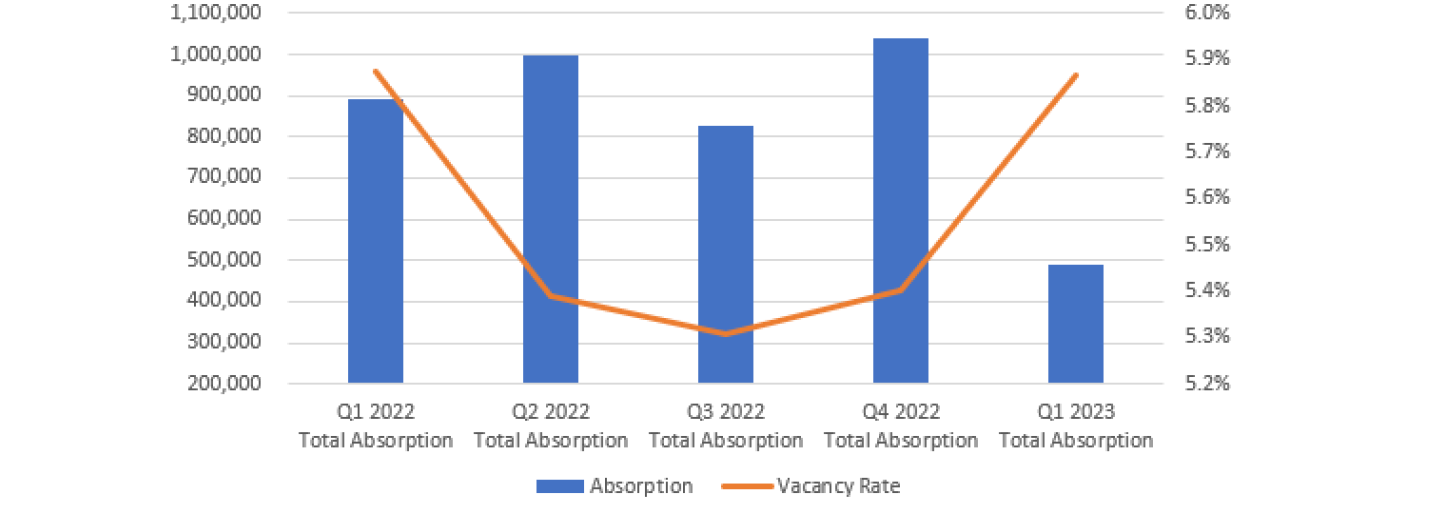
Absorption: 489,646

Vacancy: 5.9%

Asking Rate Low: $7.57

Asking Rate High: $11.08

ECONOMIC OVERVIEW:
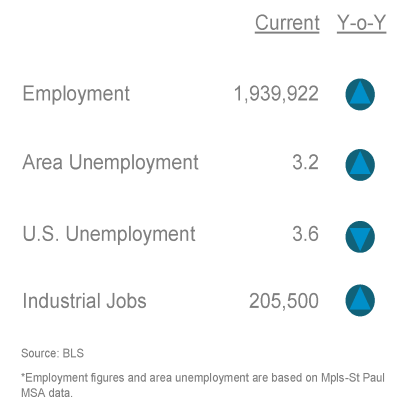
According to the Bureau of Labor Statistics (BLS), the unemployment rate for the Mpls-St Paul metropolitan statistical area (MSA) increased 80 basis points to 3.2% for February 2023 from 2.4% for February 2022. The unemployment rate for the US was at 3.6% in February 2023 down from 3.8% last year. State of Minnesota unemployment rate was 3.0%. The Mpls-St Paul MSA saw a decrease in job growth but saw an increase in industrial job growth specifically in manufacturing with 6,700 during the same period.

MPLS-ST. PAUL AREA EMPLOYMENT STATS:

Q1-2023 Industrial Employment Stats
MARKET OVERVIEW:
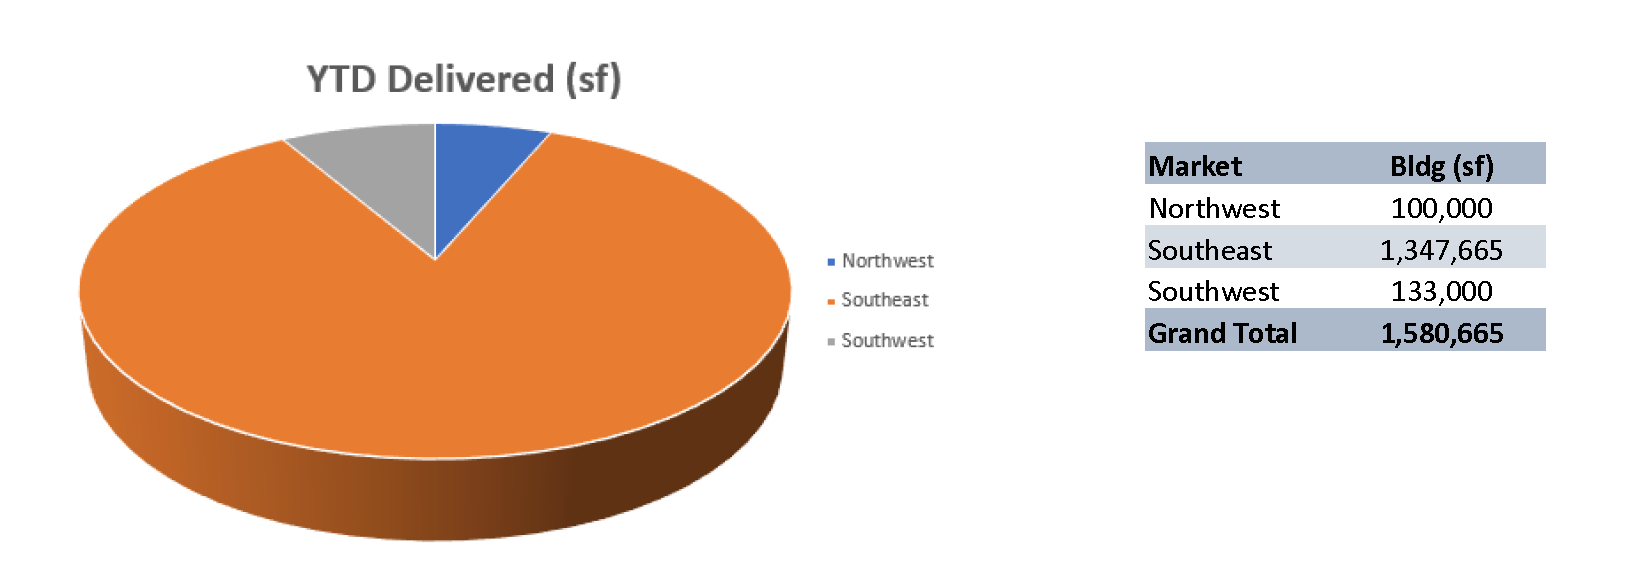
The Mpls-St Paul industrial market consists of 279.4 msf in eight counties across the metro. Overall, was just over 1.0 msf of positive absorption for Q1 2023. Multi-tenant only properties posted 489,000 sf positive absorption. The overall vacancy rate for the quarter was 3.8%, with multi-tenant vacancy at 5.9%. To date, there are 45 construction projects throughout the market totaling 8.5 msf and 7 properties have been delivered YTD with 1.58 msf.
MARKET HIGHLIGHTS:
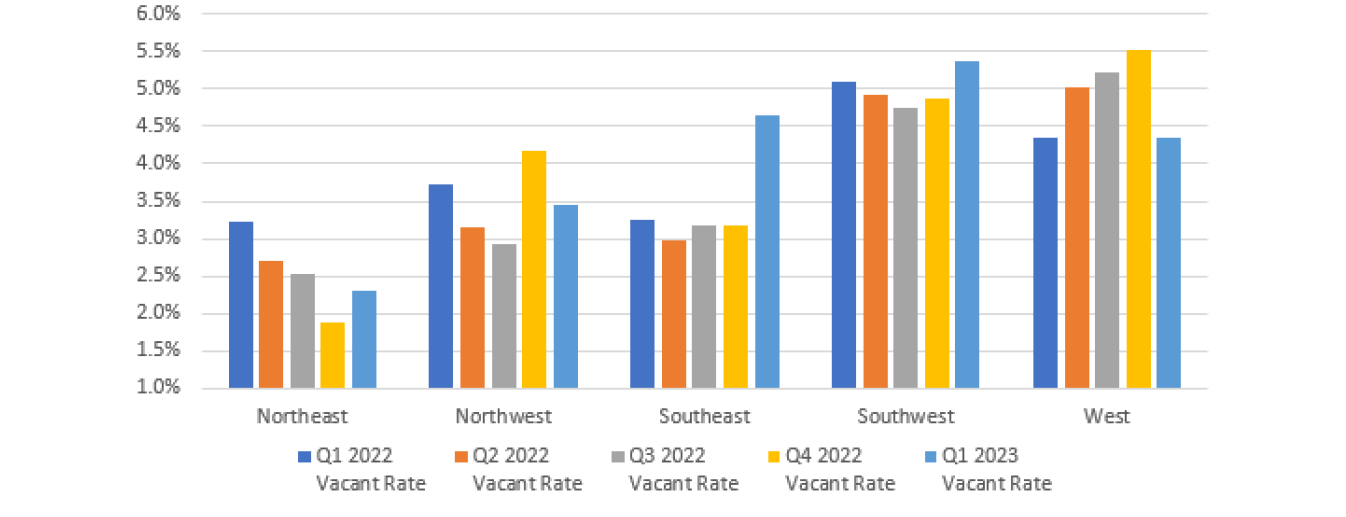
At the close of Q1 2023, the market experienced over 2.6 msf of leasing activity in 187 transactions. The Northeast market shows the lowest vacancy rate of 2.3% while the Southwest market is at the top with 5.4% for all properties. The Southeast market surpassed all markets with 594,000 sf positive absorption led by the new delivery of 417,000 sf for Home Depot. The Northeast market posted the highest drop with (281,000) sf negative absorption led by Wilson Wholesale Supply vacating 68,000 sf. The single largest direct vacancy was Smart Warehouse vacating 80,000 sf in the Southwest market. Seventy Six properties sold totaling 3.1 msf for $248.6 million.
MARKET STATISTICS BY PROPERTY TYPE
Multi and Single Tenant:
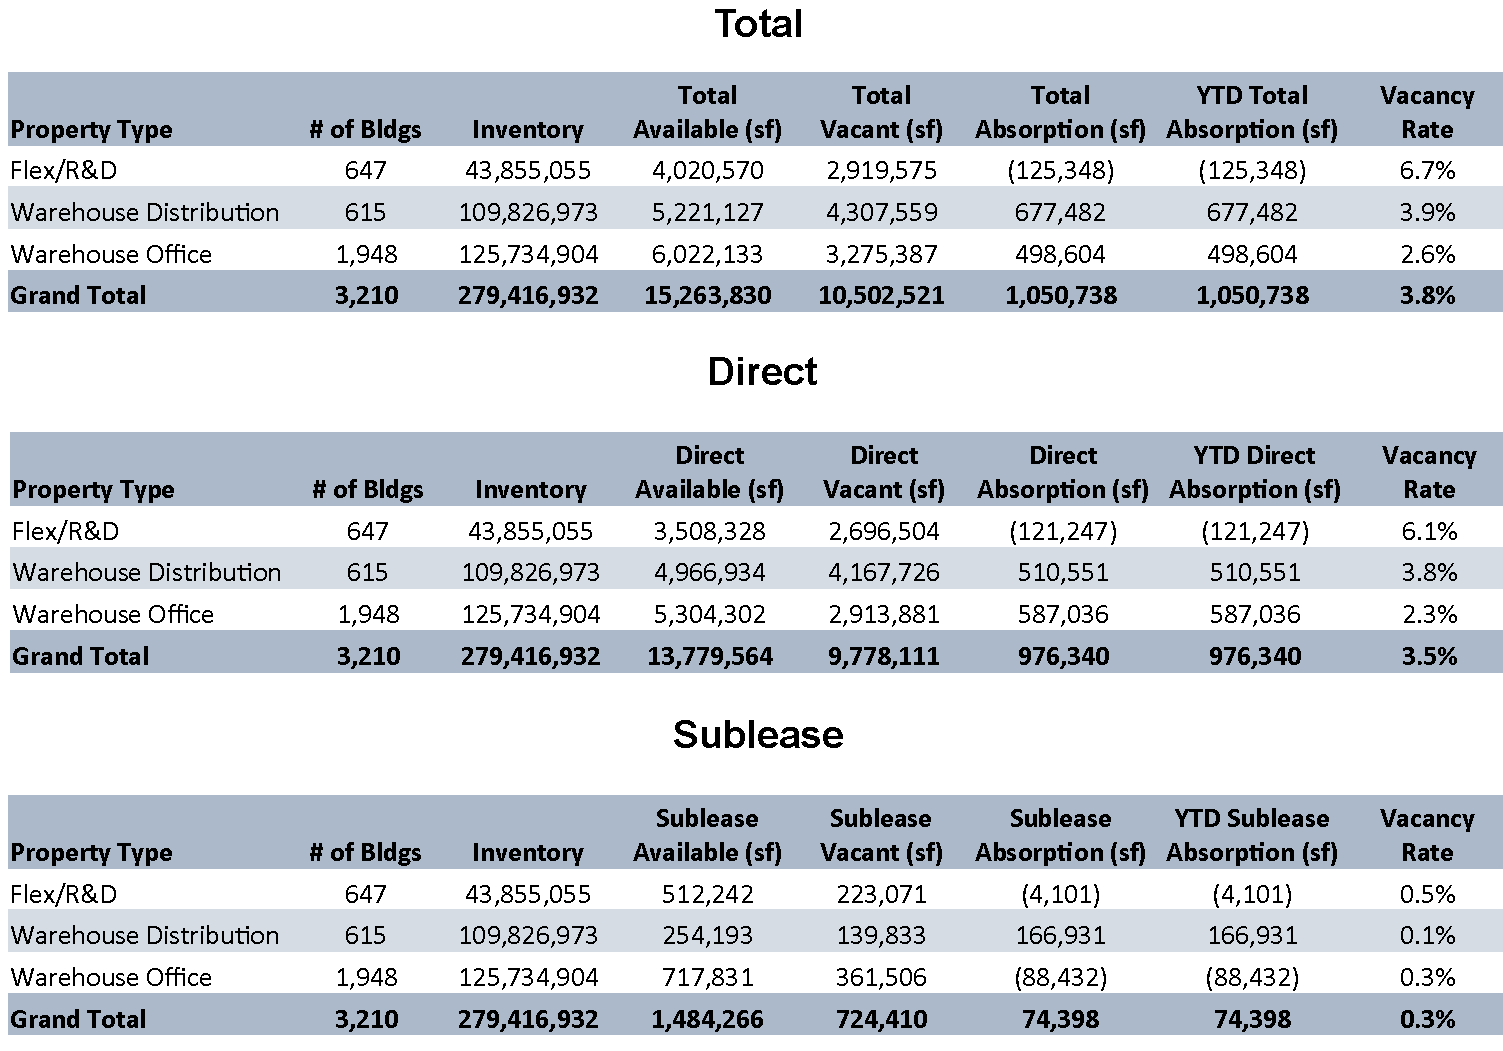
Q1-2023 Market Statistics by Property Type (Multi & Single Tenant) Table
Q1-2023 Market Statistics by Property Type (Multi & Single Tenant) Graph
VACANCY RATES BY MARKET
Multi and Single Tenant:
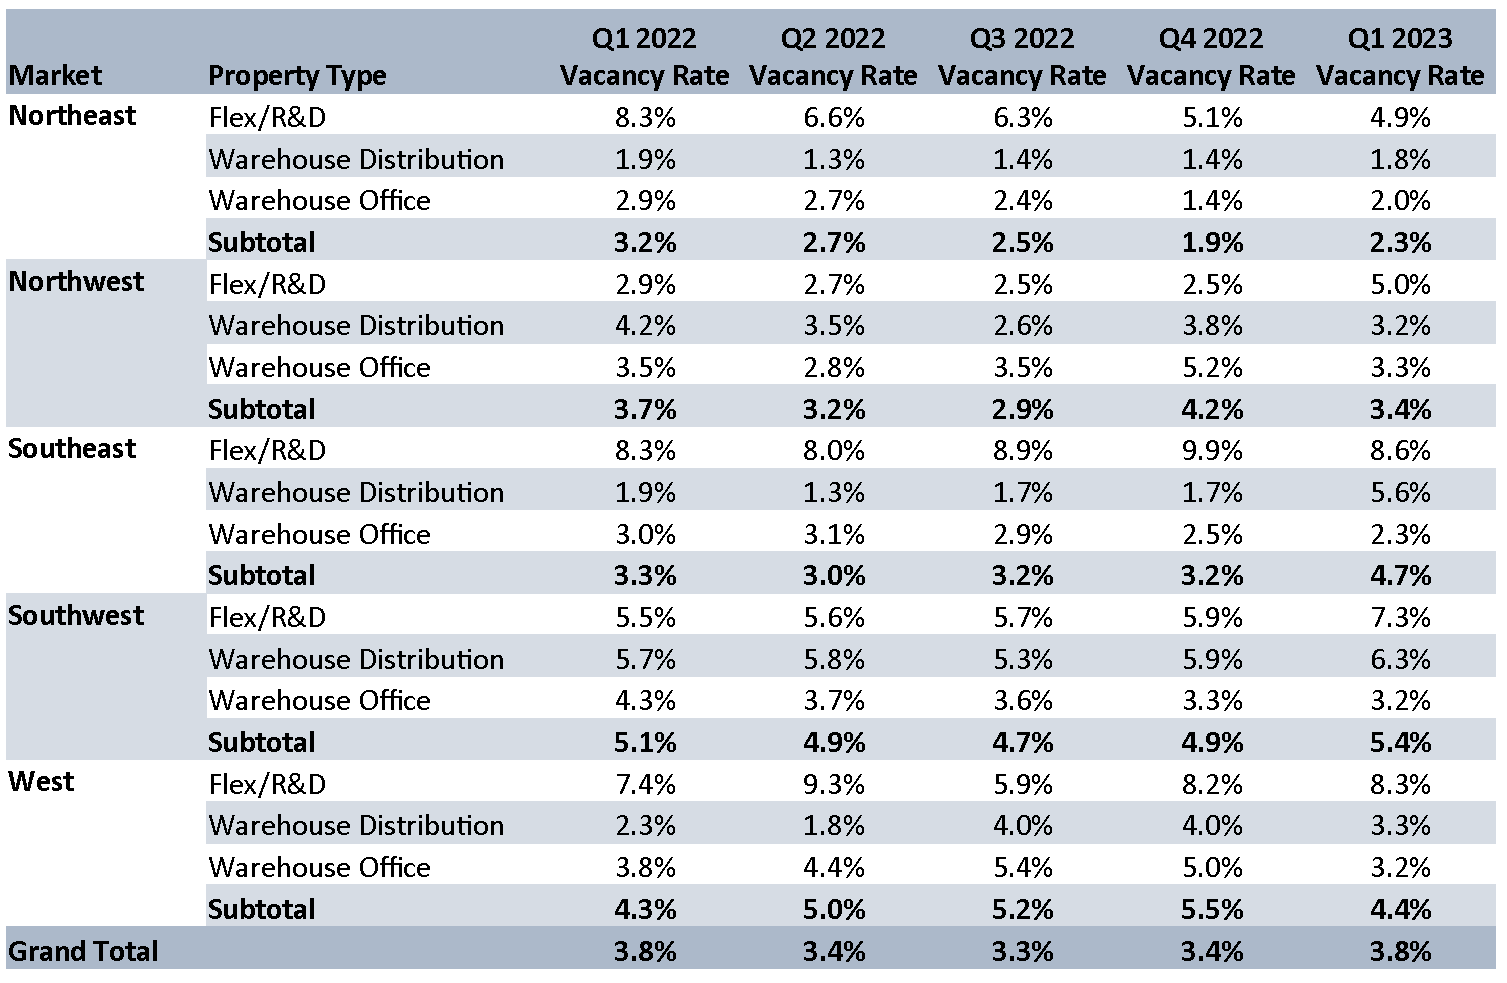
Q1-2023 Vacancy Rates by Market (Multi & Single Tenant) Table
Q1-2023 Vacancy Rates by Market (Multi & Single Tenant) Graph
LEASE RATES BY MARKET
Multi and Single Tenant NNN:
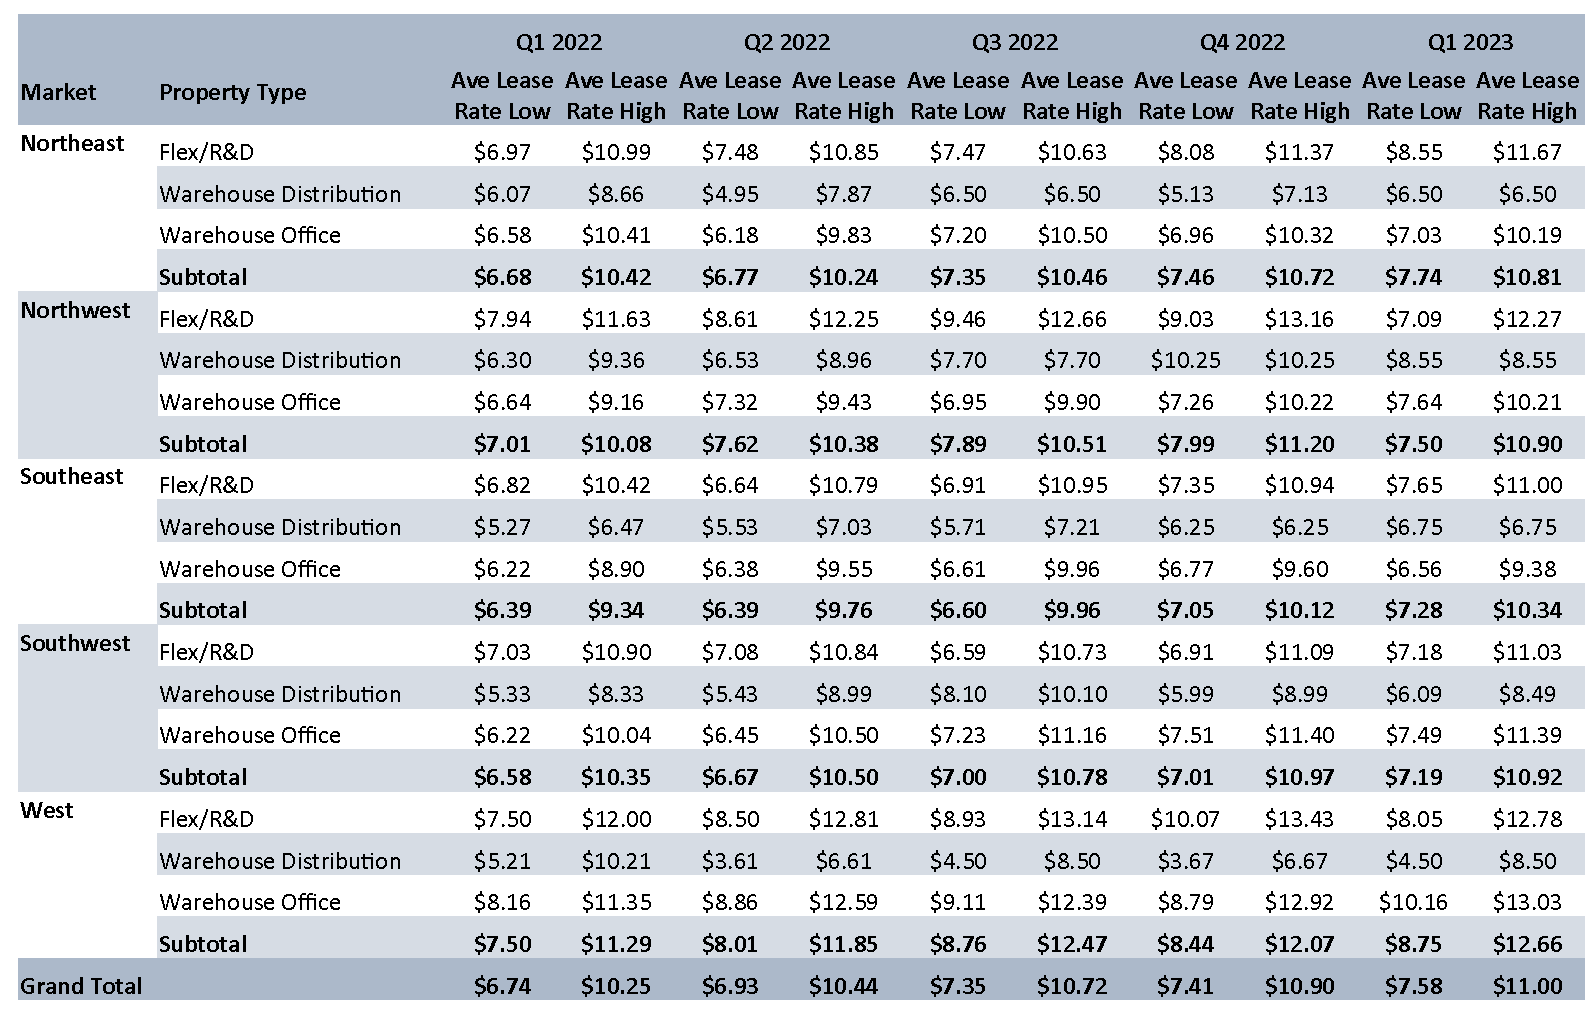
Q1-2023 Lease Rates by Market (Multi & Single Tenant NNN) Table
Q1-2023 Lease Rates by Market (Multi & Single Tenant NNN) Graph
MARKET STATISTICS BY PROPERTY TYPE
Multi Tenant:
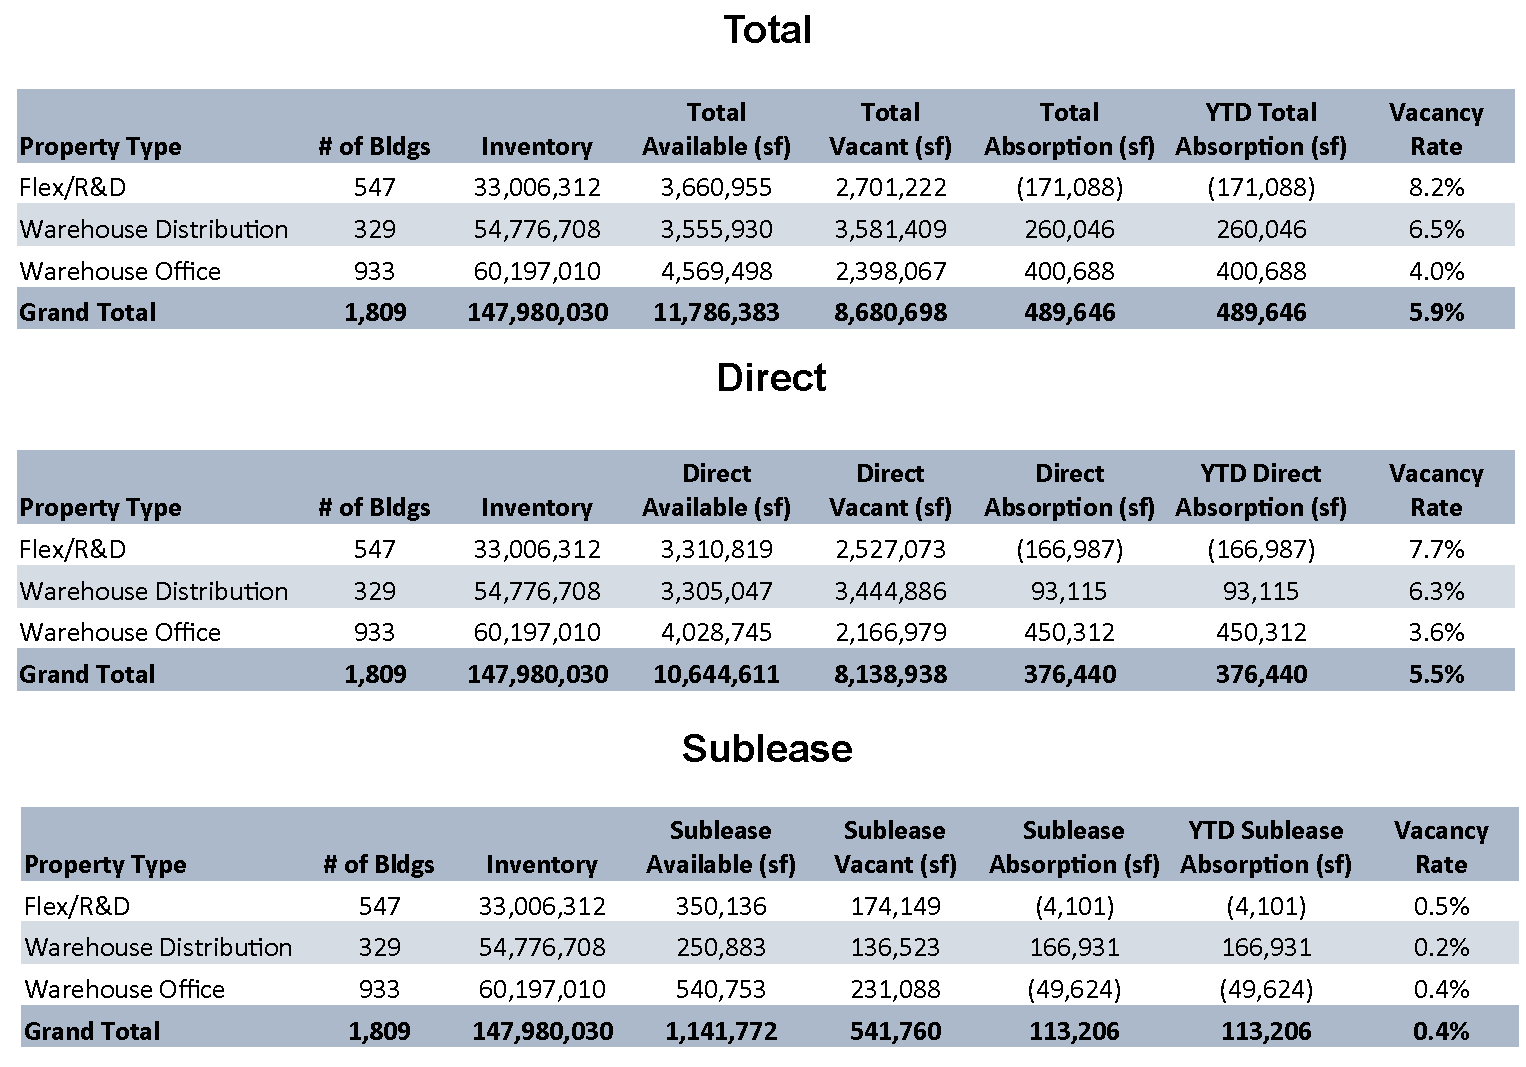
Q1-2023 Market Stats by Property Type (Multi Tenant) Table
Q1-2023 Market Stats by Property Type (Multi Tenant) Graph
NEW DEVELOPMENTS BY MARKET:
Q1-2023 New Developments by Market - Under Construction
YEAR-TO-DATE DELIVERIES BY MARKET:
Q1-2023 YTD Deliveries by Market
Q1-2022 Industrial Market Report created by Minnesota Commercial Real Estate Association. For more information, you can reach them at: www.mncar.org
Q3 2021 Employment Rates

Market Insight

Get access to all future Industrial Market Reports below

Industrial Market Experts

Phil Simonet

Phil Simonet

Principal

John Young, CCIM

John Young, CCIM

Vice President

Dan Lofgren

Dan Lofgren

Vice President

Joseph Schultz

Joseph Schultz

Senior Associate

Joe Jetland

Joe Jetland

Senior Associate

News & Updates

Q4 2023 Minneapolis-St Paul Industrial Market Summary

Q4 2023 Minneapolis-St Paul Industrial Market Summary

MARKET INSIGHT POSTQ4-2023 Minneapolis-St. Paul Industrial Market UpdateForte Principal, Phil Simonet, provides insight to the Twin Cities industrial market report recently released by MNCAR/REDI. The Minneapolis/St. Paul industrial market remains active and healthy...

Q4 2023 Minneapolis-St Paul Office Market Summary

Q4 2023 Minneapolis-St Paul Office Market Summary

MARKET INSIGHT POSTQ4-2023 Minneapolis-St. Paul Office Market UpdateForte Principal, Jim Jetland lends insight to the Twin Cities office market report recently released by MNCAR/REDI. At the risk of sounding like a “broken record” the office market in the Twin Cities...

Q3 2023 Minneapolis St Paul Office Market Summary

Q3 2023 Minneapolis St Paul Office Market Summary

MARKET INSIGHT POSTQ3-2023 Minneapolis-St. Paul Office Market UpdateForte Principal, Jim Jetland, SIOR, lends insight to the Minneapolis-St. Paul office market report recently released by MNCAR/REDI. As more office leases are expiring and most tenants contemplate...

Loading...