(952) 854-8290 info@forterep.com

Q2-2022 Industrial Market Update

MARKET RECAP:
All Properties: Total Inventory: 269,000,289 sf Total # of Buildings: 3,090 Absorption: 1,391,072 sf Vacancy: 3.5% Asking Rate Low: $6.94 NNN Asking Rate High: $10.47 NNN Under Construction: 7,156,531 sf Multi-Tenant Properties Total Inventory: 141,931,509 sf Total # of Buildings: 1,746 Absorption: 843,051 Vacancy: 5.2% Asking Rate Low: $6.94 Asking Rate High: $10.57
ECONOMIC OVERVIEW:
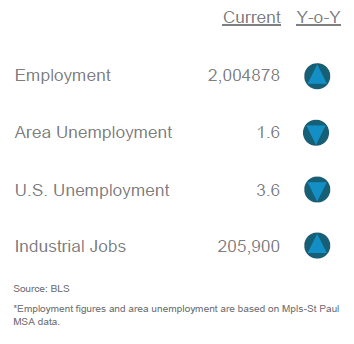
According to the Bureau of Labor Statistics (BLS), the unemployment rate for the Mpls-St Paul metropolitan statistical area (MSA) decreased 210 basis points to 1.6% for May 2022 from 3.7% for May 2021. The unemployment rate for the US was 3.6% in May 2022 down from 6.1% last year. State of Minnesota unemployment rate was 2.0%. The Mpls-St Paul MSA saw an increase in job growth as well as an increase industrial job growth in manufacturing with 13,900 during the same period.
MARKET HIGHLIGHTS:
The Mpls-St Paul industrial market consists of 269 msf in eight counties across the metro. There was just shy of 1.4 msf of positive absorption overall for Q2 2022 increasing YTD to over 2.5 msf. Multi-tenant only properties posted 843,000 sf positive absorption with YTD of 1.9 msf. The overall vacancy rate for the market dropped to 3.5% and multi-tenant vacancy dropped to 5.2% for Q2 2022. To date, there are 44 construction projects throughout the market totaling 7.1 msf and 19 properties have been delivered YTD with 2.3 msf.

MPLS-ST. PAUL AREA EMPLOYMENT STATS:

Q2-2022 Industrial Employment Stats
MARKET OVERVIEW:
At the close of Q2 2022, the market experienced over 2.8 msf of leasing activity in 202 transactions with Clark Equipment leasing the largest space of 225,000 sf in the Northwest market. The Northeast market shows the lowest vacancy rate of 2.7% while the West market is at the top with 5.0% for all properties. The Northwest market tops all markets with 566,000 sf positive absorption led by Alridge Electric leasing 150,000 sf. The top single changes were both in the Southeast market for the new delivery of the SICK building with 185,000 sf and Shop Jimmy vacating 140,000 sf. The West market shows (117,000) sf negative absorption led by Preferred One vacating 87,000 sf. Ninety four properties sold totaling 4.4 msf for $442 million. Q2-2022 Industrial Market Report created by Minnesota Commercial Real Estate Association. For more information you can reach them at: www.mncar.org
Q3 2021 Employment Rates

Industrial Market Experts

Phil Simonet

Phil Simonet

Principal

John Young, CCIM

John Young, CCIM

Vice President

Dan Lofgren

Dan Lofgren

Vice President

Joseph Schultz

Joseph Schultz

Senior Associate

Joe Jetland

Joe Jetland

Senior Associate

News & Updates

Q2 2024 Minneapolis-St. Paul Industrial Market Summary

Q2 2024 Minneapolis-St. Paul Industrial Market Summary

MARKET INSIGHTQ2 2024 Minneapolis-St. Paul Industrial Market SummaryForte's Vice President - Advisory, John Young, provides insight to the Twin Cities industrial market report recently released by MNCAR/REDI. Vacancy rates for industrial space are on the rise,...

Q2 2024 Minneapolis-St. Paul Office Market Summary

Q2 2024 Minneapolis-St. Paul Office Market Summary

MARKET INSIGHTQ2 2024 Minneapolis-St. Paul Office Market SummaryForte's Ericka Miller, Vice President Real Estate Advisory, provides insight to the Twin Cities office market report recently released by MNCAR/REDI. Low unemployment rates can often align with a strong...

Q1 2024 Minneapolis-St Paul Office Market Summary

Q1 2024 Minneapolis-St Paul Office Market Summary

MARKET INSIGHTQ1 2024 Minneapolis-St. Paul Office Market SummaryForte Principal, Jim Jetland, provides insight to the Twin Cities office market report recently released by MNCAR/REDI. While there are a few bright spots with the Twin Cities Office Market the general...

Loading...